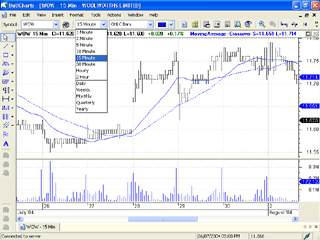
BullCharts is the only Australian made charting package that allows you to examine what is happening within a trading day, giving you a competitive edge over other traders. You can view charts with intervals of 1, 2, 5, 15, or 30 minutes, 1 hour or 2 hours, and apply the indicators and line studies to these charts.
BullCharts also dynamically updates the current price for the last bar on your chart as that stock trades!. For example, if you were viewing a daily chart of Telstra at 1:37pm on Friday, you would see a bar on your chart for Friday with the high, low and last price as of 1:37pm. As more trades occur you will see that bar move.
With other charting systems you need to wait until after the market closes before you can perform your analysis, meaning you can't make your move until the next day. With BullCharts, you can seize opportunities as they arise.


