Creating Parabolic Trendlines |
Post Reply 
|
| Author |
 Printable Version Printable Version Delicious Delicious Digg Digg Facebook Facebook Furl Furl Google Boomarks Google Boomarks Google Buzz Google Buzz MySpace MySpace Newsvine Newsvine reddit reddit StumbleUpon Translate StumbleUpon Translate Twitter Twitter Windows Live Windows Live Yahoo Bookmarks Yahoo Bookmarks Topic Search Topic Search  Topic Options Topic Options
|
damo 
Newbie 
Joined: 12 Sep 2004 Posts: 14 |
 Post Options Post Options
 Quote Reply Quote Reply
 Topic: Creating Parabolic Trendlines Topic: Creating Parabolic TrendlinesPosted: 05 May 2006 at 1:38am |
I would have mailed this to you already, but Market Analyst keeps crashing... 
|
|
 |
|
|
Owen
Regular 
Joined: 15 Nov 2004 Posts: 97 |
Post Options
Quote Reply
Posted: 12 Jan 2006 at 10:02pm |
|
Brendon you are right! I love Bullcharts even more now.
 |
|
|
|
|
Brendon
BullCharts Staff 

Joined: 10 Sep 2004 Location: Australia Posts: 126 |
Post Options
Quote Reply
Posted: 12 Jan 2006 at 11:22am |
|
Guppies' parabola is actually more like our Quarter Ellipse.
|
|
|
|
|
|
|
|
Owen
Regular
Joined: 15 Nov 2004 Posts: 97 |
Post Options
Quote Reply
Posted: 11 Jan 2006 at 9:36pm |
|
Daryl Guppy's charting package also has a parabolic tool, but it seems to work differently.
  The top chart is BC. The bottom one is from GTE Tool Box. I showed the differences on the charts. My main point is that the timing of exit is different, depending on what program you use. What do others think? Edited by Owen |
|
|
|
|
Brendon
BullCharts Staff
Joined: 10 Sep 2004 Location: Australia Posts: 126 |
Post Options
Quote Reply
Posted: 05 Dec 2005 at 6:24am |
|
Can you email to brendonl@weblink.com.au a screen shot of the options available. Thanks |
|
|
|
|
|
|
|
damo
Newbie
Joined: 12 Sep 2004 Posts: 14 |
Post Options
Quote Reply
Posted: 04 Dec 2005 at 10:14pm |
|
Can we have an option where we can increase/decrease the speed of the parabola? This is seen in FoxCharts and Market Analyst.
damo 
|
|
|
|
|
SimonSavva
Regular
Joined: 15 Sep 2004 Posts: 84 |
Post Options
Quote Reply
Posted: 28 May 2005 at 5:00pm |
|
I've never seen this before, might be quite useful as a stop loss tool. Thankyou!
|
|
|
|
|
Peter
BullCharts Staff

Joined: 09 Sep 2004 Location: Australia Posts: 241 |
Post Options
Quote Reply
Posted: 08 Mar 2005 at 3:10pm |
|
In physics, an object that is accelerating will often appear as a
parabola. Parabolic formations can also sometimes be observed in stock
market trends indicating that the rate of change is increasing, ie
accelerating.
BullCharts allows you to construct parabolic trendlines. Figure 1 shows a parabola fitting the lows on a KZL daily chart. 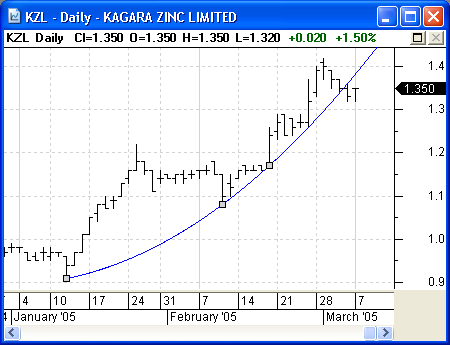 In the same way that it takes two points to described a line, it takes three points to describe a parabola. To draw a parabola, follow these steps:
|
|
|
|
|
Post Reply
|
| Forum Jump | Forum Permissions You cannot post new topics in this forum You cannot reply to topics in this forum You cannot delete your posts in this forum You cannot edit your posts in this forum You cannot create polls in this forum You cannot vote in polls in this forum |


