Creating Parabolic Trendlines
Printed From: BullCharts Forum
Category: BullCharts
Forum Name: Tips and Tricks
Forum Discription: Tips on how to use BullCharts more effectively.
URL: http://www.bullcharts.com.au/forum/forum_posts.asp?TID=167
Printed Date: 15 Dec 2025 at 6:12am
Software Version: Web Wiz Forums 9.69 - http://www.webwizforums.com
Topic: Creating Parabolic Trendlines
Posted By: Peter
Subject: Creating Parabolic Trendlines
Date Posted: 08 Mar 2005 at 3:10pm
|
In physics, an object that is accelerating will often appear as a
parabola. Parabolic formations can also sometimes be observed in stock
market trends indicating that the rate of change is increasing, ie
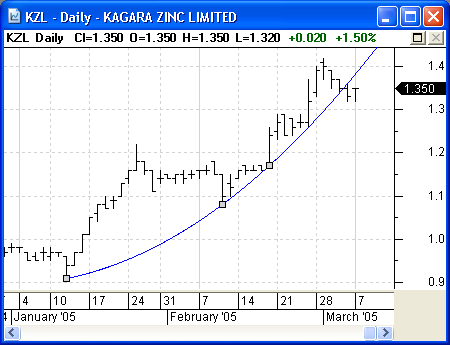
accelerating. BullCharts allows you to construct parabolic trendlines. Figure 1 shows a parabola fitting the lows on a KZL daily chart.  In the same way that it takes two points to described a line, it takes three points to describe a parabola. To draw a parabola, follow these steps:
|
Replies:
Posted By: SimonSavva
Date Posted: 28 May 2005 at 5:00pm
| I've never seen this before, might be quite useful as a stop loss tool. Thankyou! |
Posted By: damo
Date Posted: 04 Dec 2005 at 10:14pm
|
Can we have an option where we can increase/decrease the speed of the parabola? This is seen in FoxCharts and Market Analyst.
damo 
|
Posted By: Brendon
Date Posted: 05 Dec 2005 at 6:24am
|
Can you email to mailto:brendonl@weblink.com.au - brendonl@weblink.com.au a screen shot of the options available. Thanks ------------- 
|
Posted By: Owen
Date Posted: 11 Jan 2006 at 9:36pm
Daryl Guppy's charting package also has a parabolic tool, but it seems to work differently. The top chart is BC. The bottom one is from GTE Tool Box. I showed the differences on the charts. My main point is that the timing of exit is different, depending on what program you use. What do others think? |
Posted By: Brendon
Date Posted: 12 Jan 2006 at 11:22am
|
Guppies' parabola is actually more like our Quarter Ellipse. ------------- 
|
Posted By: Owen
Date Posted: 12 Jan 2006 at 10:02pm
Brendon you are right! I love Bullcharts even more now.  |
Posted By: damo
Date Posted: 05 May 2006 at 1:38am
I would have mailed this to you already, but Market Analyst keeps crashing... 
|