Heikin - Ashi Candlesticks |
Post Reply 
|
Page <1 2345> |
| Author |
 Printable Version Printable Version Delicious Delicious Digg Digg Facebook Facebook Furl Furl Google Boomarks Google Boomarks Google Buzz Google Buzz MySpace MySpace Newsvine Newsvine reddit reddit StumbleUpon Translate StumbleUpon Translate Twitter Twitter Windows Live Windows Live Yahoo Bookmarks Yahoo Bookmarks Topic Search Topic Search  Topic Options Topic Options
|
jazza 
Regular 

Joined: 10 Aug 2007 Posts: 33 |
 Post Options Post Options
 Quote Reply Quote Reply
 Posted: 16 Sep 2012 at 9:11pm Posted: 16 Sep 2012 at 9:11pm |
|
Hi Cmacdon, Agreed re many of the books out there. However of course there are some gems out there. For instance, my Thomas Bulkowski books on chart Patterns and Candlesticks are like Encyclopedia reference books! Thanks for your evaluation of the Vervoort book. He has lots of info and videos on his web site so may just look at those and avoid. Might think about the Valcu book. I do have his “Stocks and Commodities” article which gives the 5 rules. Re the graphics, the site can be a bit flakey. For adding Graphics ,JPS’s etc don’t use the quick reply box. Use the “Post Reply” Box with the blue arrow, this will bring up the message box below. Some times the top row of Icons are unreadable and the page has to be refreshed. For my previous post it would not up load in Firefox so I retried in Crome and it worked, so go figure. Cheers Jazza 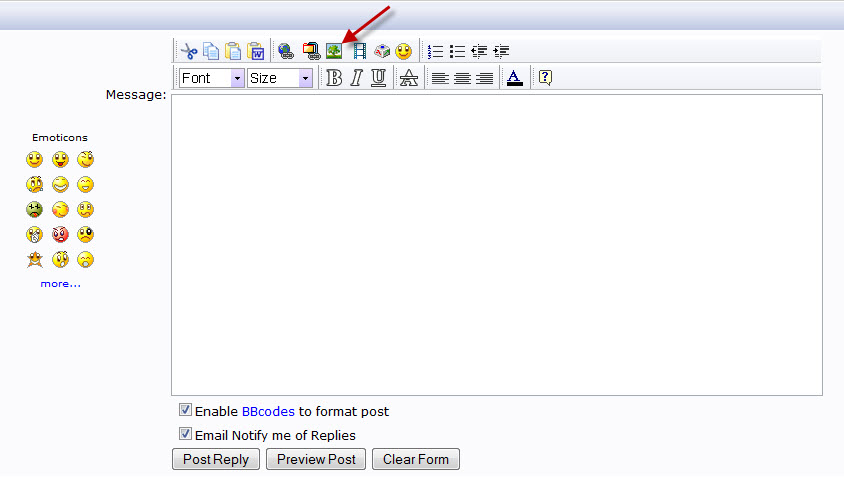 |
|
 |
|
|
cmacdon
BullCharts Guru 
Joined: 09 Sep 2012 Location: Brisbane Posts: 236 |
Post Options
Quote Reply
Posted: 17 Sep 2012 at 1:43pm |
|
Jazza Thanks for the image posting advice, I copied two charts at the bottom of the VSA Thread which are my normal VSA coloured screen and also a Heikin Ashi Bars coloured version according to my interpretation of VSA relative volume. The inidcator is an amalgamation of my last Solid colour HA bars above and the coloured VSA volume bars I previously posted on the VSA post section. It is interesting in that the reversal bar small body and large tails at the bottom of the screen really sticks out in red because it had Ultrahigh volume, whereas just looking at HA consolidation or congestion bars in one or two colours may not have alerted one that this may have been a major this was a turning point. It is Tom Williams, the inventor of VSA point, that narrow spreads with Ultra High Volume indicates smart money is active.
|
|
|
BC User since June 2007
|
|
|
|
|
cmacdon
BullCharts Guru
Joined: 09 Sep 2012 Location: Brisbane Posts: 236 |
Post Options
Quote Reply
Posted: 17 Sep 2012 at 7:21pm |
|
JazzaIf you are interested, the last chart posted in the Volume Spread Analysis posts now shows solid trend colours in the body of the HA bars, and the VSA relative volume colurs as the tails and Ha bars outline.
|
|
|
BC User since June 2007
|
|
|
|
|
jazza
Regular
Joined: 10 Aug 2007 Posts: 33 |
Post Options
Quote Reply
Posted: 19 Sep 2012 at 1:39am |
|
Maximo, got me thinking with your “fill attribute”. Had a fiddle with your formula and managed to get the candles filled but with the black outline and wicks for a crisper look. [citation="'Using The Heikin-Ashi Technique', by Dan Valcu Stocks & Commodities Feb 2004 www.traders.com"]
[target=Price]
haClose := (O+H+L+C)/4;
haOpen := (prev + hist(haClose,1))/2;
haHigh := max(H, haOpen, haClose);
haLow := min(L, haOpen, haClose);
[linestyle=Candle; color=Black]
if (haOpen < haClose,haOpen,undefined);
if (haOpen < haClose,haHigh,undefined);
if (haOpen < haClose,haLow,undefined);
if (haOpen < haClose,haClose,undefined);
[linestyle=Candle; color= Black]
If(haOpen >= haClose,haOpen,undefined);
If(haOpen >= haClose,haHigh,undefined);
If(haOpen >= haClose,haLow,undefined);
If(haOpen >= haClose,haClose,undefined);
[linestyle=fill bars; color=Red; width=4.5]
If(haOpen >= haClose,haOpen,undefined);
If(haOpen >= haClose,haClose,undefined); [linestyle=fill bars; color=Lime Green; width=4.5]
If(haOpen <= haClose,haOpen,undefined);
If(haOpen <= haClose,haClose,undefined);
|
|
|
|
|
cmacdon
BullCharts Guru
Joined: 09 Sep 2012 Location: Brisbane Posts: 236 |
Post Options
Quote Reply
Posted: 19 Sep 2012 at 8:44am |
|
Good Jazza
|
|
|
BC User since June 2007
|
|
|
|
|
cmacdon
BullCharts Guru
Joined: 09 Sep 2012 Location: Brisbane Posts: 236 |
Post Options
Quote Reply
Posted: 19 Sep 2012 at 11:08am |
|
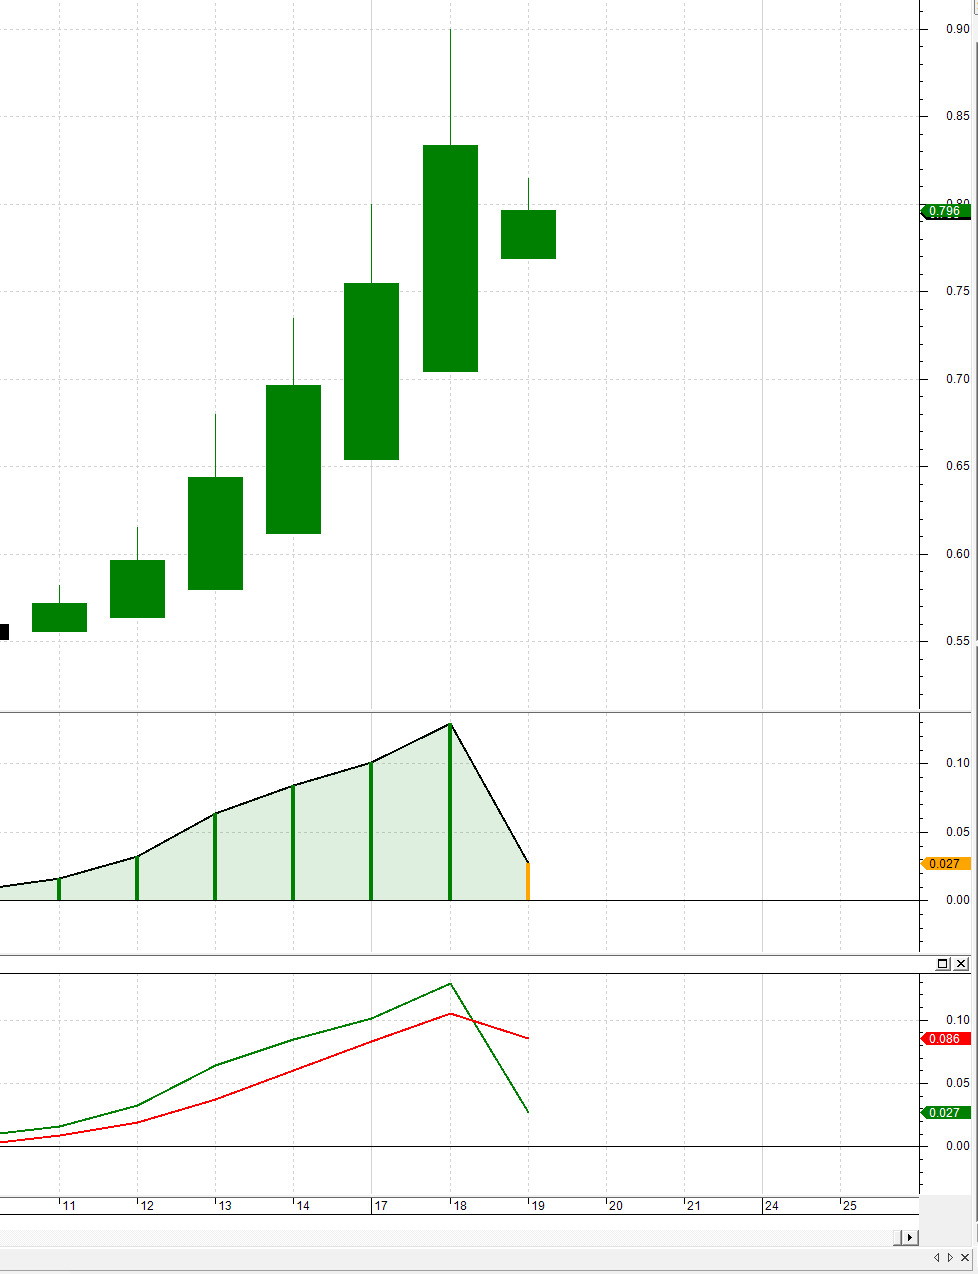
Going back to an earlier post about potential problems using HA bars to trade EOD or longer, and also the use of HA Delta or my HA Oscillator here is a good example of the issue from today's market.
At 10.30 a.m. approx AQP has dropped 12% from yesterdays high and 8% from Yesterdays Close yet the HA bar is still showing Green for an up trend. The First chart shows the OHLC bars and the next charts shows the incorrect trend indication on the last HA bar at the same point in time On the other hand, the Oscillator has picked up the change as it is coloured yellow showing a move down from a green bar indicating a decine from a maxima, and the HA Delta is showing a cross over. 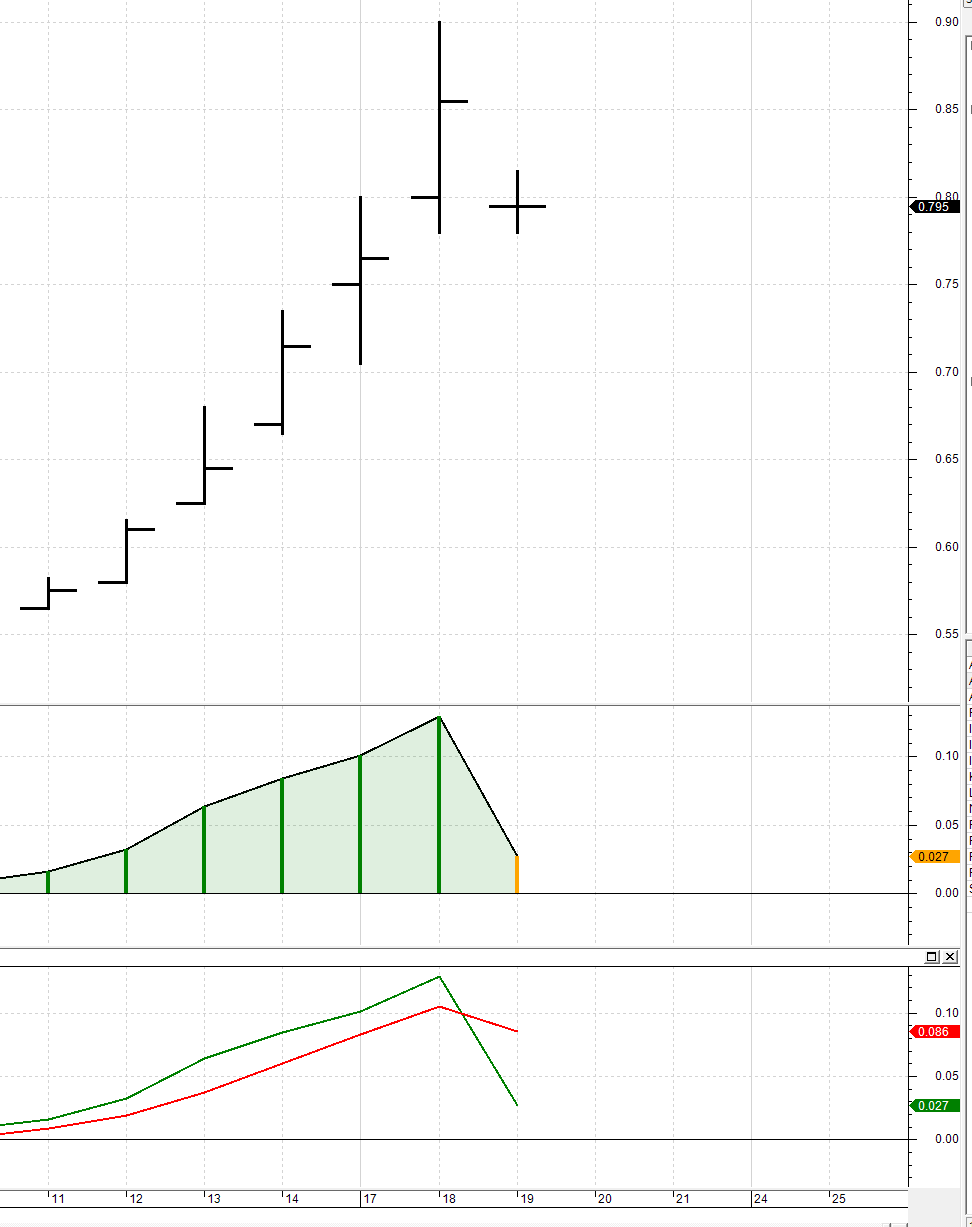 |
|
|
BC User since June 2007
|
|
|
|
|
cmacdon
BullCharts Guru
Joined: 09 Sep 2012 Location: Brisbane Posts: 236 |
Post Options
Quote Reply
Posted: 19 Sep 2012 at 11:09am |
|
|
|
BC User since June 2007
|
|
|
|
|
jazza
Regular
Joined: 10 Aug 2007 Posts: 33 |
Post Options
Quote Reply
Posted: 19 Sep 2012 at 1:54pm |
|
Hi Cmacdon, Interesting point re HA. I have been looking at the HA delta(3) and have come to the conclusion that it is gives too many false signals. I think you alluded to that in an earlier post. Still think the HA is a great trend trading tool. At the moment, I am combining it with my favorite momentum oscillator, a 7 period RSI |
|
|
|
|
cmacdon
BullCharts Guru
Joined: 09 Sep 2012 Location: Brisbane Posts: 236 |
Post Options
Quote Reply
Posted: 14 Oct 2012 at 12:58pm |
|
Here is a potential fix/improvement to the problem noted above regarding late signals, potential whipsaws or incorrect signals using traditional Heikin Ashi defined bars.
The key issue underlying HA bars is a moving average concept. The definition of HaClose is := (
O+H+L+C)/4; and this MA estimate flows into each of the other definitions of HAHigh, HALow and HA Open bars. In a lot of indicators based on moving averages, I tend to always use "pldot" as the moving average definition, as it tends to produce a very smooth MA and, because it is based on the last 3 bars the MA has a built in momentum component. Pldot was invented by Charles Drummond, a Canadian Trader and is the core input to Drummond Geometry Trading approach and software. pldot:=((( hist(h,0)+hist(Low,0)+hist(C,0))/3)+((hist(h,1)+hist(Low,1)+hist(C,1))/3)+((hist(h,2)+hist(Low,2)+hist(C,2))/3))/3; replace the definition of HaClose to - haclose:=pldot, you get the improved charting results I show in the first comparison chart below. On the charts I have noted the potential benefits for trading using HA-pldot bars on the charts as I see them. You can make up your own minds.I used AQP as the security, as it had the problem I noted above in an earlier post when it was still showing a HA up bar when clearly the market had turned. Chart2 is my previous HA coloured bars for comparison purposes showing problematic turning points or potential whipsaw bars. Chart 3 is Maximo's originally defined Heikin Ashi bars. Also showing comparative turning points or potential whipsaws traditional defined HA bars. 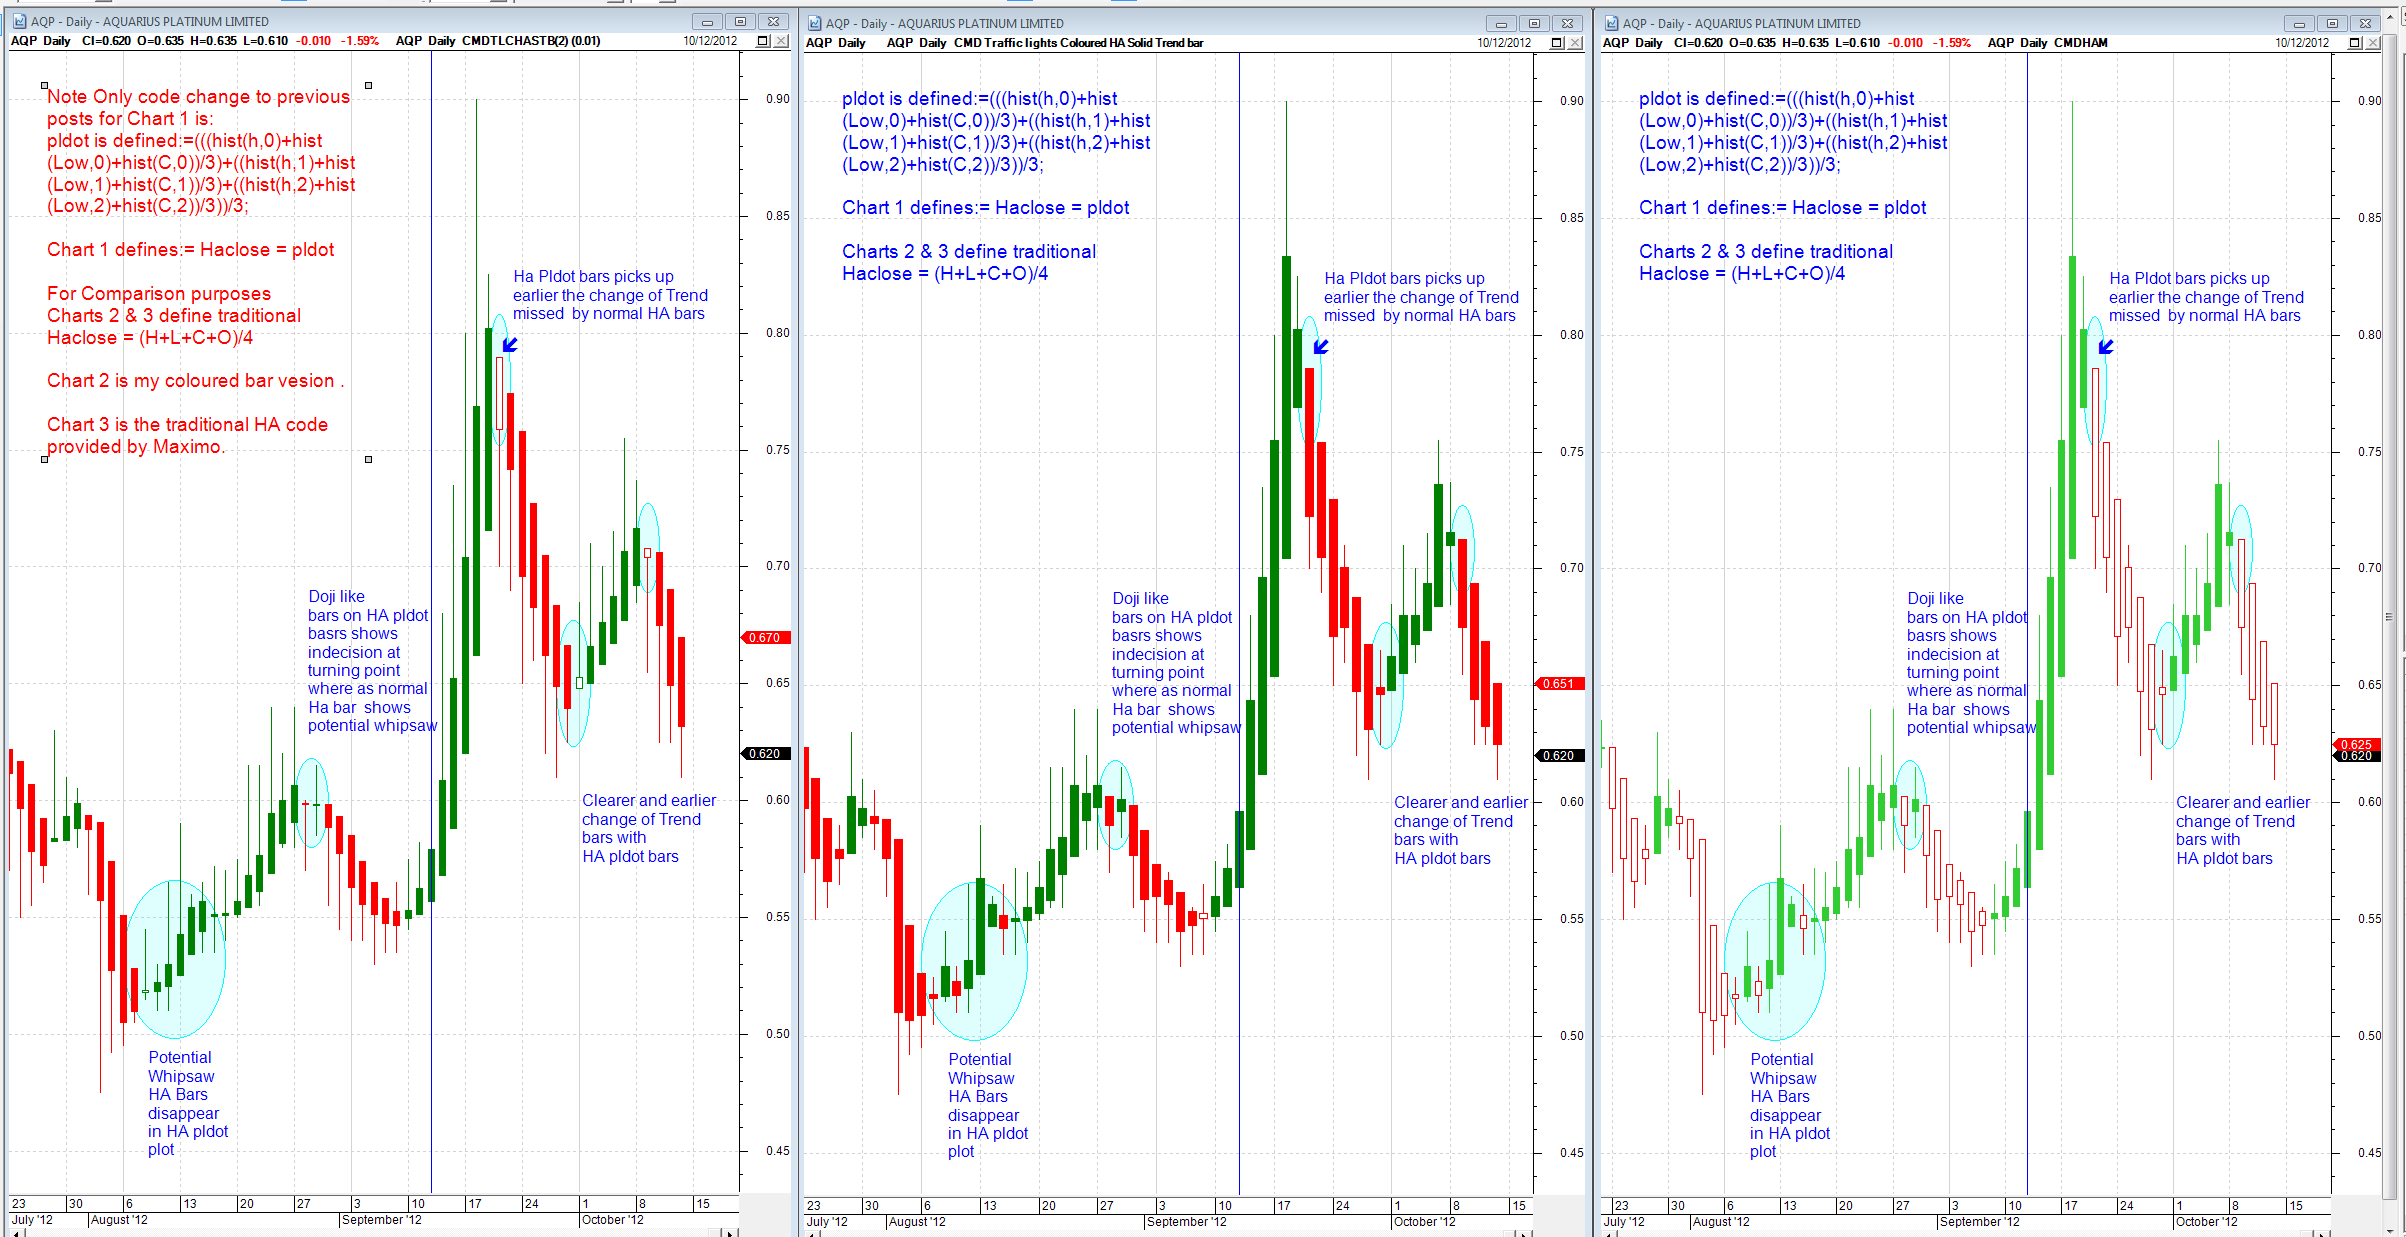 |
|
|
BC User since June 2007
|
|
|
|
|
cmacdon
BullCharts Guru
Joined: 09 Sep 2012 Location: Brisbane Posts: 236 |
Post Options
Quote Reply
Posted: 14 Oct 2012 at 8:58pm |
|
In this chart, I thought it might be worth comparing how smooth is pldot compared to a couple of other ways to develop similar indicators.
Chart 1 is the amended HA-pldot bars with Bollinger bands at 1 and 2 standard deviations where BB is based also on pldot. Chart 2 is traditional HA bars and traditional Bollinger bands calculations based on the close rather than pldot. Chart 3 is similar to t he above but BB is based on Hull Moving average which is one of the fastest MA configurations available. In my view Chart 1 show that a system based on pldot has the edge in providing clearer potential signals. Each 5 min chart is based on 10 period MA. 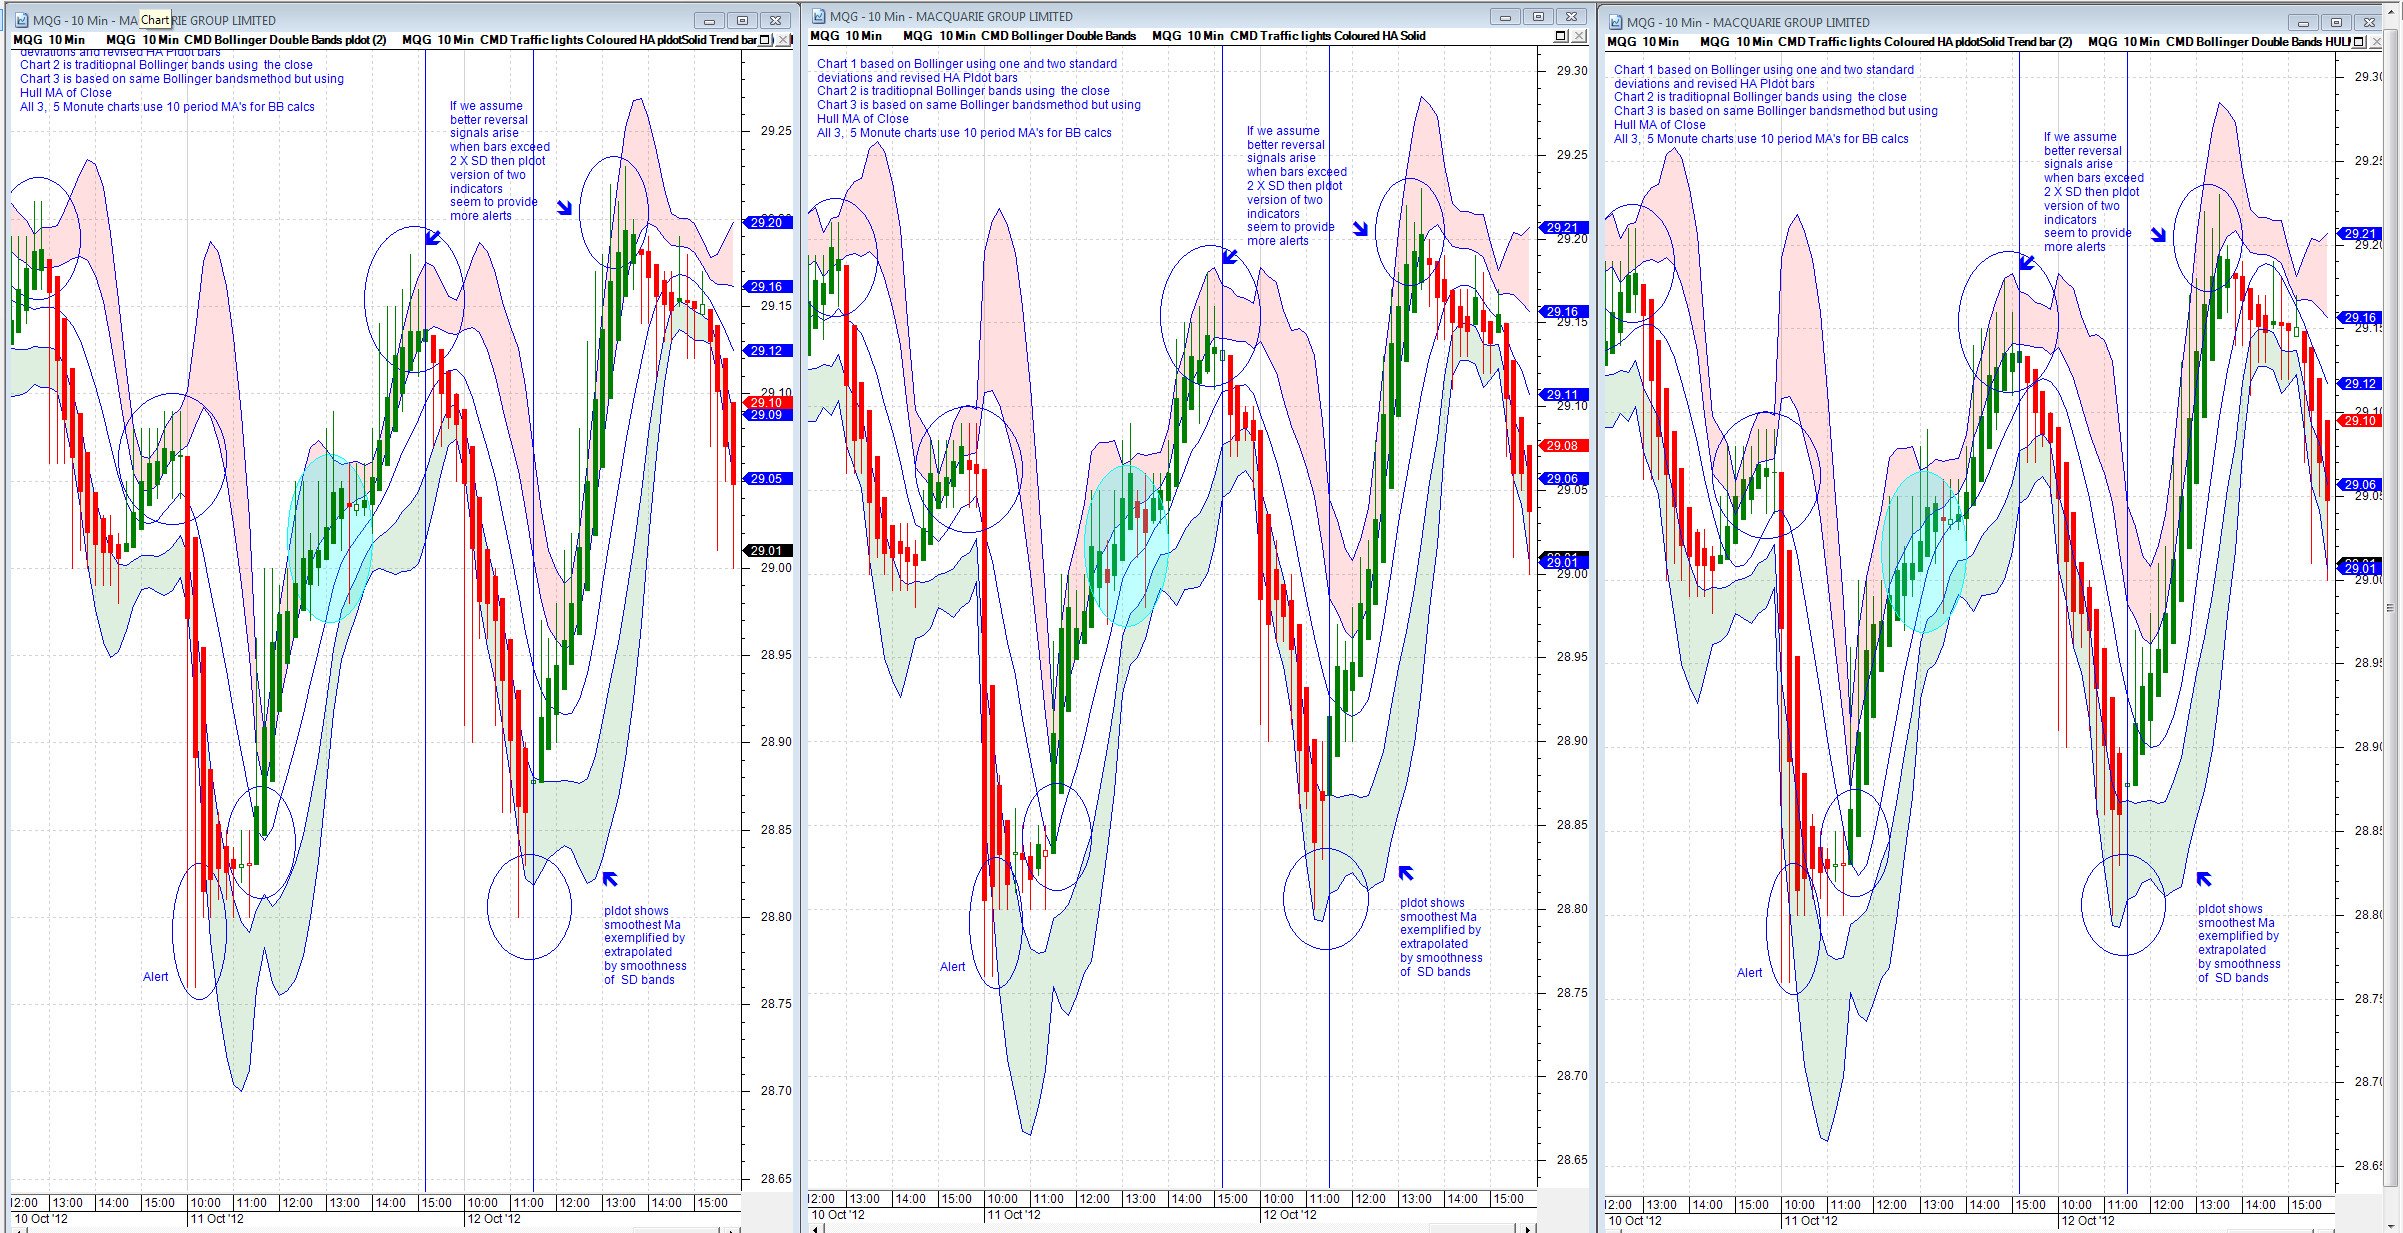 |
|
|
BC User since June 2007
|
|
|
|
|
Post Reply
|
Page <1 2345> |
| Forum Jump | Forum Permissions You cannot post new topics in this forum You cannot reply to topics in this forum You cannot delete your posts in this forum You cannot edit your posts in this forum You cannot create polls in this forum You cannot vote in polls in this forum |


