Heikin - Ashi Candlesticks
Printed From: BullCharts Forum
Category: BullCharts
Forum Name: BullScript
Forum Discription: Technical discussion related specifically to the BullScript programming language.
URL: http://www.bullcharts.com.au/forum/forum_posts.asp?TID=852
Printed Date: 19 May 2024 at 8:07am
Software Version: Web Wiz Forums 9.69 - http://www.webwizforums.com
Topic: Heikin - Ashi Candlesticks
Posted By: jazza
Subject: Heikin - Ashi Candlesticks
Date Posted: 09 Sep 2012 at 2:28am
|
I am stumped trying to change the default colors in the Heikin – Ashi Bullscript indicator. It shows candles with a higher close than open as color Blue. Lower close than open candles are in White. This is of course the opposite of what we are used to with any candle pattern. I am trying to reverse this color coding. Have spent lots of time getting nowhere. I am sure the answer is simple. Can one of the expert script writers help me with this one please! Thanks in advance.
|
Replies:
Posted By: maximo
Date Posted: 09 Sep 2012 at 2:07pm
|
I managed to get the bars a different colour depending on trend, but couldn't get the down bars to solid fill.
[citation ="'Using The Heikin-Ashi Technique', by Dan Valcu Stocks & Commodities Feb 2004 www.traders.com"][target =Price]haClose := ( O+H+L+C)/4;haOpen := ( prev + hist(haClose,1))/2;haHigh := max(H, haOpen, haClose);haLow := min(L, haOpen, haClose);[linestyle =Candle][color =lime green]if (haOpen < haClose,haOpen,undefined);if (haOpen < haClose,haHigh,undefined);if (haOpen < haClose,haLow,undefined);if (haOpen < haClose,haClose,undefined);[linestyle =Candle][color =red]If (haOpen >= haClose,haOpen,undefined);If (haOpen >= haClose,haHigh,undefined);If (haOpen >= haClose,haLow,undefined);If (haOpen >= haClose,haClose,undefined); |
Posted By: cmacdon
Date Posted: 10 Sep 2012 at 11:00am
|
Here are 3 indicators which together form my Heiking Ashi template. On the first and thrid indicator I use 3 different colours for up and down trends and also congestion areas. Congestion is indicated by HA bar that has a top and bottom tail. The separate indicators are 1 Heiking -Ashi bars 2 Heiking -Ashi Oscillator 3 1 Heiking -Ashi Wave volume (the second half of this indicator code is similar to that applied in recent Weiss wave post and can be easily adapted to many other Bullchart indicators where accumulated volume is needed). ------------------------------------------------------------ [citation ="'Using
The Heikin-Ashi Technique', by Dan Valcu Stocks & Commodities Feb 2004 and
Valcu, Heikin-Ashi, How to trade without candlestick Patterns, Educofin, 2011; "] {cmacdon’s
HA bars with congestion bars. Originally
called Traffic lights} [target=Price;] haClose
:= (O+H+L+C)/4; haOpen
:= (prev + hist(haClose,1))/2; haHigh
:= max(H, haOpen, haClose); haLow
:= min(L, haOpen, haClose); haCl:=((O+H+L+C)/4+haOpen+Max((O+H+L+C)/4,Max(H,haOpen))+Min((O+H+L+C)/4,Min(L,haOpen)))/4; Greenlight:=Hahigh-haopen; Redlight:=Halow-haOpen; {I changed this to a difference calculation so as to
net off the minor congestion amounts to whatever is net up or down trend.} LightDiff:=Greenlight+Redlight; [linestyle=Candle;color=Green; ] If(lightdiff >=0.000,haOpen,undefined); If(lightdiff >=0.000, haHigh,undefined); If(lightdiff >=0.000, haLow,undefined); If(lightdiff >=0.000, haClose,undefined); [linestyle=Candle;color=Red; ] If(lightdiff <=0.000,haOpen,undefined); If(lightdiff <=0.000, haHigh,undefined); If(lightdiff <=0.000, haLow,undefined); If(lightdiff <=0.000, haClose,undefined); [linestyle=Candle;color=Black; ] If(Greenlight >0.000 and Redlight <-0.000,haOpen,undefined); If(Greenlight >0.000 and Redlight <-0.000,
haHigh,undefined); If(Greenlight >0.000 and Redlight <-0.000,
haLow,undefined); If(Greenlight >0.000 and Redlight <-0.000,
haClose,undefined); [citation ="'Using
The Heikin-Ashi Technique', by Dan Valcu Stocks & Commodities Feb 2004 and
Valcu, Heikin-Ashi, How to trade without candlestick Patterns, Educofin, 2011; "] {This
indicator creates an Oscillator with congestion bars absorbed into the closest
up or down trend. Valcu does not use
oscillators this way} haClose
:= (O+H+L+C)/4; haOpen
:= (prev + hist(haClose,1))/2; haHigh
:= max(H, haOpen, haClose); haLow
:= min(L, haOpen, haClose); haCl:=((O+H+L+C)/4+haOpen+Max((O+H+L+C)/4,Max(H,haOpen))+Min((O+H+L+C)/4,Min(L,haOpen)))/4; Greenlight:=HaClose-haOpen; [name=Green Traffic Lights1; linestyle=Solid; width=2] [color=Black; name=Greenlight] Greenlight; d:=0; [horzline=0]; [linestyle=fill; color=Green;] Greenlight;
[linestyle=fill; color=RED;]d; {This section shows shows lighter coloured bars as
the differences above or below zero shrink, or in otherwords, the oscillator
moves up or down from a maxima or minima.} [name=Green Traffic Lights1; linestyle=bar; width=4] [color=Green; name=Greenlight] If(Greenlight>=0,Greenlight,undefined); [name=Red Traffic Lights2; linestyle=bar; width=4] [color=Orange; name=Redlight2] If(Greenlight>=0 AND Greenlight<Hist(Greenlight,1),Greenlight,undefined); [name=Red Traffic Lights3; linestyle=bar; width=4] [color=Red; name=Redlight] If(Greenlight<0,Greenlight,undefined); [name=Red Traffic Lights4; linestyle=bar; width=4] [color=Lime; name=Redlight2] If(Greenlight<0 AND Greenlight>Hist(Greenlight,1),Greenlight,undefined); [citation ="'Using The Heikin-Ashi Technique', by Dan
Valcu Stocks & Commodities Feb 2004 and Valcu, Heikin-Ashi, How to trade
without candlestick Patterns, Educofin, 2011"] {cmacdon's HA wave vol version. Valcu does not show Volume this way.} haClose
:= (O+H+L+C)/4; haOpen
:= (prev + hist(haClose,1))/2; haHigh
:= max(H, haOpen, haClose); haLow
:= min(L, haOpen, haClose); haCl:=((O+H+L+C)/4+haOpen+Max((O+H+L+C)/4,Max(H,haOpen))+Min((O+H+L+C)/4,Min(L,haOpen)))/4; Greenlight:=Hahigh-haopen; Redlight:=Halow-haOpen; LightDiff:=Greenlight+Redlight; {The section shows the total or average wave volume
for each up or down trend or congestion areas shown by the HA bars. (The part of the formula can be easily
adapted to most other indicators by defining the parameters for the BuyVol and
downvol from any other indicator. For
instance if the indicator was a crossover of the close the set up is BuyVol
=c>Ma(c,30,s) and Down Vol<Ma(c,30,s))} v1:=input("1=Total volume on wave
or 2=Average volume on wave", 2, 1, 2); [linestyle=Bar; width=4] [name=Preferred Buy Vol; color=Green] Buyvol:=
Greenlight >=0.0000001
and Redlight
>=-0.0000000; BuyVol2:=If(BuyVol,+1*v,0); TotalBuyVol:=If( BuyVol ,+1*v+prev(BuyVol2),0); Buybars:=barssince(Buyvol2=0); if(v1=2,TotalBuyVol,undefined); if(v1=1,TotalBuyVol/buybars,undefined); [name=Preferred Sell Vol; color=Red] Sellvol:=
Greenlight <=0.0000000
and Redlight
<=0.0000001; SellVol2:=If(SellVol,+1*v,0); TotalSellVol:=If( SellVol ,+1*v+prev(SellVol2),0); Sellbars:=barssince(Sellvol2=0); if(v1=2,TotalSellVol,undefined); if(v1=1,TotalSellVol/Sellbars,undefined); {Heikin Ashi also has congestion bars. Refer Dan Valcu’s article in Tasc or his
book, “Heikin-Ashi, How to trade without candlestick Patterms, Educofin,2011 } [name=Congestion Vol; color=black] Convol:=
Greenlight >=0.0000001
and Redlight
<=-0.0000001; ConVol2:=If(ConVol,+1*v,0); TotalConVol:=If( ConVol ,+1*v+prev(ConVol2),0); Conbars:=barssince(Convol2=0); if(v1=2,TotalConVol,undefined); if(v1=1,TotalConVol/Conbars,undefined); |
Posted By: Gordon7
Date Posted: 10 Sep 2012 at 1:56pm
|
Thanks very much for the above coding guys, very much appreciated. Has anyone coded Valcu's haDelta indicator which he uses in conjunction with the heikin-ashi chart and as an early warning of trend change ? Would love to have this or something similar. Gordon |
Posted By: jazza
Date Posted: 10 Sep 2012 at 2:47pm
|
Maximo, that’s certainly an improvement visually. As always,
thanks very much for your tireless input. Mucho appreciated. Cheers. Still curious as to why the down candles can’t be solid
filled? Hopefully one of the Bullcharts programmers might have a solution. Gordon, thanks very much for sharing your HA formulas and
template. Looks very interesting Will study and analyze . Great coding. Cheers. |
Posted By: Gordon7
Date Posted: 10 Sep 2012 at 3:35pm
No, that was cmacdon who shared his formulas. Credit where credit is due  Gordon |
Posted By: cmacdon
Date Posted: 10 Sep 2012 at 6:53pm
|
Tried coding HA delta when Valcus book came out but, in my opinion, it is more erratic than the Ha oscillator provided above. ------------- BC User since June 2007 |
Posted By: jazza
Date Posted: 11 Sep 2012 at 1:23am
|
Dan Valcu uses this setup on his website. It has his "ha Delta>SMA(haDelta,3)" This is to overcome the lagging aspects of the Heikin-Ashi. His formula description from the website: " The difference between ha Close and ha Open. Combined with a 3 day simple moving av. SMA(3). Visually it looks like a momentum oscillator as per below. Well beyond my script writing skills. Can I call on some more help again please. Mucho appreciated in advance. 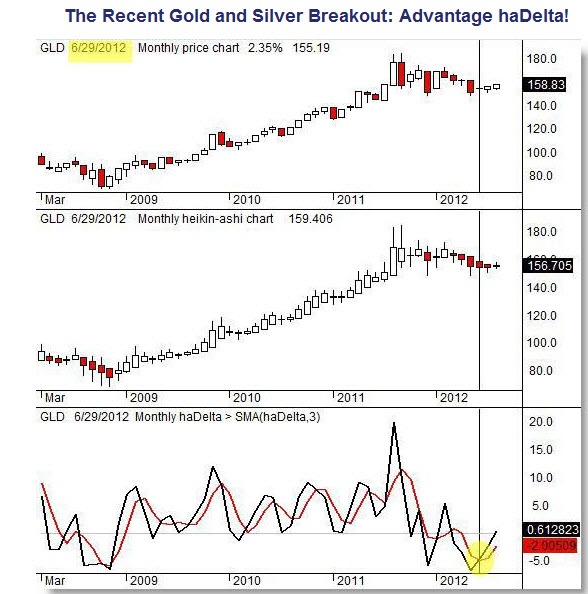 |
Posted By: cmacdon
Date Posted: 11 Sep 2012 at 7:28am
|
I dug this out of my archived indicators I think ha Delta is haclose -haOpen otherwise you get an inverted oscilator. haClose := ( O+H+L+C)/4; haOpen := ( prev + hist(haClose,1))/2; haHigh := max(H, haOpen, haClose); haLow := min(L, haOpen, haClose); haCl:=(( O+H+L+C)/4+haOpen+Max((O+H+L+C)/4,Max(H,haOpen))+Min((O+H+L+C)/4,Min(L,haOpen)))/4;
[linestyle =solid; width=2] [name =haDelta; color=Green] haDelta:= haClose-haOpen; haDelta; [linestyle =solid; width=2] [name =SMAhaDelta; color=Red] Sdelta:= ma(haDelta,3,s); sdelta; [horzline =0] ------------- BC User since June 2007 |
Posted By: cmacdon
Date Posted: 11 Sep 2012 at 7:44am
|
incidentally, the first indicator I sent through yesterday is the same as haDelta with out the 3 day Ma of Delta. haDelta is effectively the body of a ha bar without the tails. ------------- BC User since June 2007 |
Posted By: Gordon7
Date Posted: 11 Sep 2012 at 7:46am
|
Thanks cmacdon, it matches the haDelta as it appears on the sample charts on the educofin website. It's the same as your oscillator but with a 3 day simple moving average overlaid. |
Posted By: jazza
Date Posted: 11 Sep 2012 at 3:45pm
|
Works a treat. Thanks also for the explanation re your other indicators from yesterday. As always, very much appreciate your help. Cheers |
Posted By: cmacdon
Date Posted: 11 Sep 2012 at 6:58pm
|
Set out below is another Heikin Ashi "related" indicator that shows and colours actual bars according to the relevant HA bar that would have been superimposed over it. The memorandum at the top of the indicator code explains why I have found it to be more appropriate for for use in actula trading EOD or longer tradingperids. It may help overcome tje earlier issue oif showiung fills on candlestick bars as it can be used to colours OHLC bars as well as normal candlesticks. ------------------------------------------------------------------------------------- {Heikin-Ashi is fine for trading intraday as gaps
between actual bars are usually minimal intraday. However, one of the potential
drawbacks when trying to trade end of day (or longer) is that the
"synthetic" Ha bars bars drawn
over actual bars look good on a chart but in trading reality it may be
difficult to get order fills or be exact in order placementusing Ha Bars (you cannot get an order
fill within a gap which is often absore3d into a HA bar). A "work
around" is to colour real bars with the colour of a relevant HA bar. This methods expose the gaps between real price bars.
This indicator attempts to do that. For this indicator, congestion bars are absorbed into
up or down HA colours.} [target=Price; linestyle=PriceColor] haClose
:= (O+H+L+C)/4; haOpen
:= (prev + hist(haClose,1))/2; haHigh
:= max(H, haOpen, haClose); haLow
:= min(L, haOpen, haClose); haCl:=((O+H+L+C)/4+haOpen+Max((O+H+L+C)/4,Max(H,haOpen))+Min((O+H+L+C)/4,Min(L,haOpen)))/4; Greenlight:=Hahigh-haopen; Redlight:=Halow-haOpen; { Inetted off the Traffic lights bars to give longer
trends instead of the showing congestion bars} Difflight:=Greenlight+Redlight; [color=Green; name=Trendup] Difflight
>=0.000; [color=Red; name=TrendDown] Difflight
<=0.000; ------------- BC User since June 2007 |
Posted By: jazza
Date Posted: 11 Sep 2012 at 10:46pm
|
Hi Cmacdon, Nice addition to the Heikin-Ashi. Interesting points you make. I am very new to Heikin -Ashi, but love the way it filters out the noise and shows the trend. At this stage I am using it in conjunction with normal candlesticks for the more specific price action and gaps that you are pointing out. I tried the candlestick overide on the Bullcharts and some more fiddles with the formula but still can't get those pesky down candles to fill! As always, thanks for your contributions and help. Cheers |
Posted By: cmacdon
Date Posted: 12 Sep 2012 at 9:11am
|
Jazza Ifyou apply the above HA colour bar indicator, turn on candlestick on the top of the chart drop down menu, double click on any price bar to bring up the Price Plot Properties, click on Colour tab, and in that screen click on fill all bars - it will give you , normal candlesticks with the solid fill HA colours you want. That will probably save you having two screens one with HA and one your normal candlesticks if that is how you are set up. ------------- BC User since June 2007 |
Posted By: jazza
Date Posted: 13 Sep 2012 at 2:13am
|
Hi Cmacdon, That’s great. Got it working, thanks very much for that. I am still trying to replicate the true Heikin- Ashi candlestick formula with the colors filled or with white up and black down candles. If I use your HA formula as: [target=Price; linestyle=PriceColor] then I will get the OHLC bars which I can override and fill in the price plot as you say , but ends up as a standard colorized Candle price chart, albeit with the trend change colorized ,still not with the HA averaged out bars. If I go back to the original formula, yours, Maximo’ or Bullcharts as: [linestyle=Candle], then when it is added to the chart as a Candle, it overrides the drop down menu. If you double click the candle, you will not get the price plot. Any other ideas on how to get those candles filled? Cheers Jazza |
Posted By: cmacdon
Date Posted: 13 Sep 2012 at 9:07am
|
Jazza You can get what you want albeit with some smoke and mirrors but you also end up with Black up bars and White down HA bars that appear solid fills. Take Maximos candlestick code and change the Lime Green colour to Black and the Red Colour to White. That will give the perception of solid up black bars and solid down white bars. Copy that amended code and change the Target=Price to Target=ribbon, and reverse the colour Black to White and color white to Black. Put that new ribbon indicator on the chart and go into the advance setting on the ribbon and tick the box solid background. That gives you the ha bars illusion you want and clearly shows the Ha up and down trend. ------------- BC User since June 2007 |
Posted By: jazza
Date Posted: 13 Sep 2012 at 12:04pm
|
Hi Cmacdon, Nice bit of lateral thinking re the trend via the ribbon. Still doesn’t solve our problem of unfilled down candles. Maybe just got to get my head around the visual flip. Hopefully a solution somewhere. Thanks again for all your help and input so far. Cheers Jazza |
Posted By: cmacdon
Date Posted: 13 Sep 2012 at 3:45pm
|
Jazza I do not know if you have tried the abovebut as well as the Ribbon backgound it shows the proper HA bars filled in solid black for up and solid white for down. ------------- BC User since June 2007 |
Posted By: jazza
Date Posted: 13 Sep 2012 at 11:45pm
|
Hi Cmcdon, I think we have a slight misunderstanding with terminology. I think the screen shot below is the final result we are talking about? My point, is that I am trying to achieve the opposite of that, with the white candles for up and the black candles for down as per normal candlestick custom. Maybe answer is for a “Solid fill” attribute to be added to Bullscript or HA to be coded and added to the linestyle dropdown menu? Cheers for hanging in with this one, Jazza 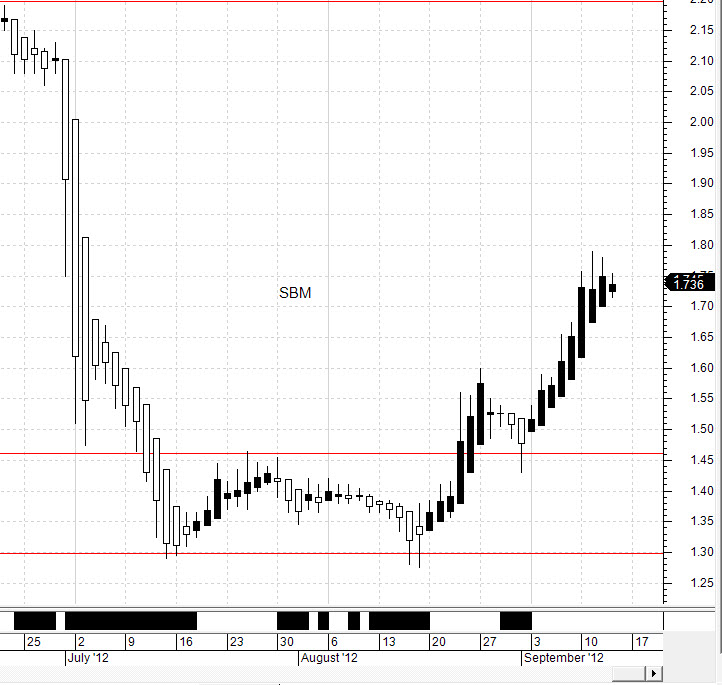
|
Posted By: maximo
Date Posted: 14 Sep 2012 at 2:27am
|
Attribute found! :P
[citation ="'Using The Heikin-Ashi Technique', by Dan Valcu Stocks & Commodities Feb 2004 www.traders.com"][target =Price]haClose := ( O+H+L+C)/4;haOpen := ( prev + hist(haClose,1))/2;haHigh := max(H, haOpen, haClose);haLow := min(L, haOpen, haClose);[linestyle =Candle; color=lime green]if (haOpen < haClose,haOpen,undefined);if (haOpen < haClose,haHigh,undefined);if (haOpen < haClose,haLow,undefined);if (haOpen < haClose,haClose,undefined);[linestyle =Candle; color=indian red]If (haOpen >= haClose,haOpen,undefined);If (haOpen >= haClose,haHigh,undefined);If (haOpen >= haClose,haLow,undefined);If (haOpen >= haClose,haClose,undefined);[linestyle =fill bars; color=indian red; width=4]If (haOpen >= haClose,haOpen,undefined);If (haOpen >= haClose,haClose,undefined); |
Posted By: cmacdon
Date Posted: 14 Sep 2012 at 7:04am
|
Thats great Maximo It worked well on ha bars when I zoomed out on a chart but I had to change the width to 8 when I zoomed in on ha bars as it otherwise was just showing a coloured stripe on the wider down bars; and was not filling across the full width of the wider (zoomed in bar). Note sure if the width can be set up to automatically fill fully across all the time? ------------- BC User since June 2007 |
Posted By: maximo
Date Posted: 14 Sep 2012 at 2:34pm
| I think zooming a chart is an internal function of the software and probably not detectable in scripting. Ideally the software should be scaling the width relative to zoom for filling bars. |
Posted By: cmacdon
Date Posted: 15 Sep 2012 at 12:59am
|
Maximo and Jazza The London market seemed to be going crazy so I pulled out and had another look at this. Here is another "partial solution" to Colouring up and down HA bars in solid colour. I used Maximo's original HA coloured bar coding and added a third section for solid colour blue bars explained below. If you load up the indicator on a chart you will get the original white down bars with red outline and green as shown by Maximo originally. If you go into the indicator properties and tick Partial solution you will see that the white down bars are then coloured solid blue. In adding the extra bit of code I had assumed rightly or wrongly that there is something in the underling Bullscript Candle linestyle attibute code that otherwise makes the down bars white. The sequence of the HA definitions is basically in the order O,H,L,C (haopen hahigh, haclose then halow). So I assumed one could "trick" the Linesttyle candlestick code to still accept the ha bars but not as the usual candlestick format. Hence, I added the third colour blue code section where I put the ha definitions in a different order. after various trial and errors L,C,H,O worked and produced the solid blue coloured bars as you can see. The bars are exact as far as I can see for toptails and shaven head HA bars. However, the solution is only partial as i noticed that main body of a few some bars where some ha bars had lower tails are included as an extension of the main body. This may be an issue in the case of interpreting congestion bars but as the intension is to use the solid colours as trend indications it may not be a problem. However, I could not find a differnt order for the lasst section of code that worked to resolve this issue. You may be able to fix from you knowledge. I think it is a useful trend indicator even with this issue. [citation ="'Using The Heikin-Ashi Technique', by Dan Valcu Stocks & Commodities Feb 2004 www.traders.com" ] [target =Price ] haClose := ( O +H+L+C)/4; haOpen := ( prev + hist(haClose,1))/2; haHigh := max (H, haOpen, haClose); haLow := min (L, haOpen, haClose); [linestyle =Candle ] [color =lime green ] if (haOpen < haClose,haOpen, undefined); if (haOpen < haClose,haHigh, undefined); if (haOpen < haClose,haLow, undefined); if (haOpen < haClose,haClose, undefined); [linestyle =Candle ] [color =red ] If (haOpen >= haClose,haOpen, undefined); If (haOpen >= haClose,haHigh, undefined); If (haOpen >= haClose,haLow, undefined); If (haOpen >= haClose,haClose, undefined); [name =Partial Solution; linestyle =Candle ; color=Blue; visible=false;] If (haOpen >= haClose,haLow, undefined); If (haOpen >= haClose,haClose, undefined); If (haOpen >= haClose,haHigh, undefined); If (haOpen >= haClose,haOpen, undefined); ------------- BC User since June 2007 |
Posted By: cmacdon
Date Posted: 15 Sep 2012 at 10:25am
|
Jazza and MaximoHere they are. I went back to my original code and played around with the order of Ha definitions in the Down trend bars and after similar trial and error the solid colours worked and the proper tails are shown on both up and down Ha bars (The order needs to be Haclose at top and Ha open at the bottom in between hahigh and ha low can be any order. I retried this ranking on partial solution code sent earlier but that did not remedy the down tail problem on earlier post). There are two indicators below the solid colour trends (doesn't distinguish congestion bars and the second indicator showing the congestion bars in Black ( For some unknown reason in the second indicator when I distinguish the congestion bars in black the congestion bars appear as either white or black solid bodies. That does not matter if you are using the first indicator). 1 is solid colour HA trend indicator 2 is the same but with the congestion bars in black ---------------------------------------------------------------------------------------- [target =Price;] haClose := ( O+H+L+C)/4; haOpen := ( prev + hist(haClose,1))/2; haHigh := max(H, haOpen, haClose); haLow := min(L, haOpen, haClose); haCl:=(( O+H+L+C)/4+haOpen+Max((O+H+L+C)/4,Max(H,haOpen))+Min((O+H+L+C)/4,Min(L,haOpen)))/4; Greenlight:=Hahigh-haopen; Redlight:=Halow-haOpen; {I changed this to a difference to net off the minor congestion amounts to whatever if the largest Traffic light tmeasure. this makes the trends more continuous for the coloured bars} LightDiff:=Greenlight+Redlight;
[linestyle=Candle;color=Green; ] If (lightdiff >=0.000,haOpen,undefined); If (lightdiff >=0.000, haHigh,undefined); If (lightdiff >=0.000, haLow,undefined); If (lightdiff >=0.000, haClose,undefined); [linestyle =Candle;color=Red; ] If (lightdiff <=0.000, haClose,undefined); If (lightdiff <=0.000, haLow,undefined); If (lightdiff <=0.000, haHigh,undefined); If (lightdiff <=0.000,haOpen,undefined);
{end of indicator1} [target =Price;] haClose := ( O+H+L+C)/4; haOpen := ( prev + hist(haClose,1))/2; haHigh := max(H, haOpen, haClose); haLow := min(L, haOpen, haClose); haCl:=(( O+H+L+C)/4+haOpen+Max((O+H+L+C)/4,Max(H,haOpen))+Min((O+H+L+C)/4,Min(L,haOpen)))/4; Greenlight:=Hahigh-haopen; Redlight:=Halow-haOpen; {I changed this to a difference to net off the minor congestion amounts to whatever if the largest Traffic light tmeasure. this makes the trends more continuous for the coloured bars} LightDiff:=Greenlight+Redlight;
[linestyle=Candle;color=Green; ] If (lightdiff >=0.000,haOpen,undefined); If (lightdiff >=0.000, haHigh,undefined); If (lightdiff >=0.000, haLow,undefined); If (lightdiff >=0.000, haClose,undefined); [linestyle =Candle;color=Red; ] If (lightdiff <=0.000, haClose,undefined); If (lightdiff <=0.000, haLow,undefined); If (lightdiff <=0.000, haHigh,undefined); If (lightdiff <=0.000,haOpen,undefined); [linestyle =Candle;color=Black; ] If (Greenlight >0.000 and Redlight <-0.000, haClose,undefined); If (Greenlight >0.000 and Redlight <-0.000, haLow,undefined); If (Greenlight >0.000 and Redlight <-0.000, haHigh,undefined); If (Greenlight >0.000 and Redlight <-0.000, haOpen,undefined); ------------- BC User since June 2007 |
Posted By: cmacdon
Date Posted: 15 Sep 2012 at 10:46am
|
Serendipidy never ends! Maybe a third indicator. I just changed the above code for the congestion bars section as shown below and this produced all trend up bars in White and all down trend in black which is the way they are shown in Valcu's book mentioned earlier and also in Sylvain Vervoort "Capturing Profit with Technical analysis, Market Place Books 2009; and I think Jazza alternative to colour requirement.[linestyle =Candle;color=Black; ] If (Greenlight >=0.000 and Redlight <=-0.000, haClose,undefined); If (Greenlight >=0.000 and Redlight <=-0.000, haLow,undefined); If (Greenlight >=0.000 and Redlight <=-0.000, haHigh,undefined); If (Greenlight >=0.000 and Redlight <=-0.000, haOpen,undefined); ------------- BC User since June 2007 |
Posted By: jazza
Date Posted: 16 Sep 2012 at 2:05pm
|
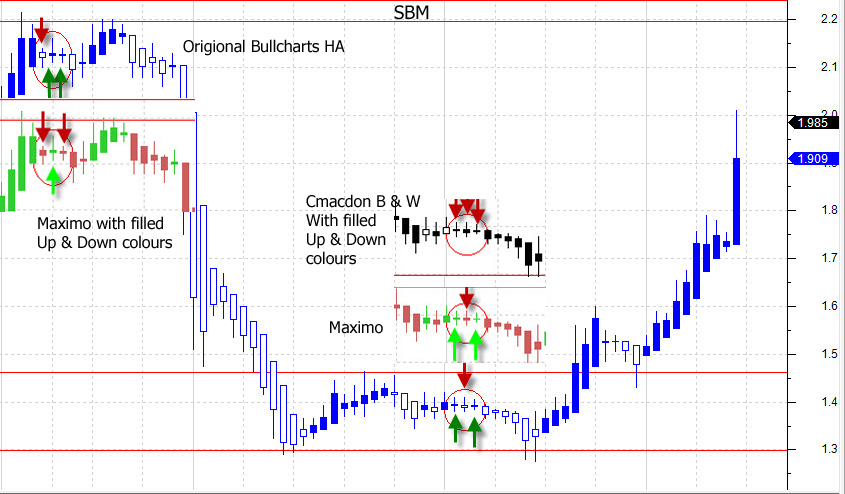
Hi Cmacdon and Maximo, Hearty congrats, great effort. Very happy with these solutions. Sorry about the late reply but immediately noticed some visual anomalies that I wanted to figure out first. Noticed that some of the close priced congestion bars differed in trend between the different solutions as per the super imposed screen shot below. The answer is easy once you know but it took me some time to figure out. Zooming the page corrects the candle Up/Down anomalies. I put the formula into an excel spread sheet and it checked out. I also carefully checked the price of the HA candle with the Crosshair under zoom and they were correct. The HA formula alters all the OHLC prices to 3 decimal point increments at different times. In respect to the Origional Bullcharts HA formula, when the Candle bodies are small, unfilled candles do not visually cope with these fractions and can be filled under normal unzoomed conditions. When you are looking at the “Hard Right Edge” of the chart I think this is Important. Certainly Maximo, love your solid fill Up/Down color solution as it solves any ambiguity as to whether the HA bars have closed up or down in narrow ranges. Cmacdon, as a Black and White candlestick traditionalist, I also love you’re your solution. Just gotta remember to zoom in with congestion bars if you are concerned about the correct open or close. Thanks guys, Cheers. PS: Cmacdon, figure from previous comments that you may have the Sylvain Vervoort book “Capturing profit with technical analysis” Worth buying in your opinion?
|
Posted By: cmacdon
Date Posted: 16 Sep 2012 at 4:37pm
|
Jazza Like most trading books I have and there are many on shelves behind me, I tend to read them only once and do not reread them again unless they are really focused onto something that is fundamental to understanding a particular aspect of trading or the market process that is useful to me. In other words, the books need to be really focused and with some depth thereon to a particular issue before I would reread. (There are numerous light weight books out there that are that are focused on reexplaining MACD, RSI and maybe stochastics? They tend to be repetitive and at the end of the day thoroughly boring.) In my opinion, Vervoort's book tries to cover too much ground in one book. He expalins HA bars , and covers his SVAPO oscillator system and "Lockitt"which is the name of his trading methodology but this entails covering Heikin Ashi, and Candlesticks (of which there are many other books) and Elliott waves (of which there are too too many other books) and Risk Management ( of which there are many other books), Babson and Pitchforks, resistance levels and Fibbonnacci etc. I only referred to his book in my post as I wanted to compare whether his uptrends and down trend HA bars were the same black and white direction as shown in Falcu's book cited earlier, and your suggestion that Bullcharts was back to front. Personally it does not matter to me which way the colours or B&W) go as long as they are consistenlt the same way. I do not know if you have it but, Part One (Chapters 1-7) of Falcu's book is good as he focuses purely on explaining HA, and the table on page 22 is particularly useful as it gives you the 5 rules for translating HA bars so you can trade them. The rest of the book compares the HA approach to candlesticks, moving averages, ichimoku, market breadth , pivotts and Forex. So I might reread Section one from time to time. Hope that helps By the way how do you post graphics on your posst as I tried to post a graphic of a chart the other day and the forum pst reply process did not accept the graphic. ------------- BC User since June 2007 |
Posted By: cmacdon
Date Posted: 16 Sep 2012 at 4:58pm
|
Just noticed, must be a good week as I joined the forum last week to discuss a few things I was interested in and I have been promoted from a newbie to a regular by the system. I need to go back into my shell. ------------- BC User since June 2007 |
Posted By: jazza
Date Posted: 16 Sep 2012 at 8:57pm
|
|
Posted By: jazza
Date Posted: 16 Sep 2012 at 9:11pm
|
Hi Cmacdon, Agreed re many of the books out there. However of course there are some gems out there. For instance, my Thomas Bulkowski books on chart Patterns and Candlesticks are like Encyclopedia reference books! Thanks for your evaluation of the Vervoort book. He has lots of info and videos on his web site so may just look at those and avoid. Might think about the Valcu book. I do have his “Stocks and Commodities” article which gives the 5 rules. Re the graphics, the site can be a bit flakey. For adding Graphics ,JPS’s etc don’t use the quick reply box. Use the “Post Reply” Box with the blue arrow, this will bring up the message box below. Some times the top row of Icons are unreadable and the page has to be refreshed. For my previous post it would not up load in Firefox so I retried in Crome and it worked, so go figure. Cheers Jazza  |
Posted By: cmacdon
Date Posted: 17 Sep 2012 at 1:43pm
|
Jazza Thanks for the image posting advice, I copied two charts at the bottom of the VSA Thread which are my normal VSA coloured screen and also a Heikin Ashi Bars coloured version according to my interpretation of VSA relative volume. The inidcator is an amalgamation of my last Solid colour HA bars above and the coloured VSA volume bars I previously posted on the VSA post section. It is interesting in that the reversal bar small body and large tails at the bottom of the screen really sticks out in red because it had Ultrahigh volume, whereas just looking at HA consolidation or congestion bars in one or two colours may not have alerted one that this may have been a major this was a turning point. It is Tom Williams, the inventor of VSA point, that narrow spreads with Ultra High Volume indicates smart money is active. ------------- BC User since June 2007 |
Posted By: cmacdon
Date Posted: 17 Sep 2012 at 7:21pm
|
JazzaIf you are interested, the last chart posted in the Volume Spread Analysis posts now shows solid trend colours in the body of the HA bars, and the VSA relative volume colurs as the tails and Ha bars outline. ------------- BC User since June 2007 |
Posted By: jazza
Date Posted: 19 Sep 2012 at 1:39am
|
Maximo, got me thinking with your “fill attribute”. Had a fiddle with your formula and managed to get the candles filled but with the black outline and wicks for a crisper look. [citation="'Using The Heikin-Ashi Technique', by Dan Valcu Stocks & Commodities Feb 2004 www.traders.com"]
[target=Price]
haClose := (O+H+L+C)/4;
haOpen := (prev + hist(haClose,1))/2;
haHigh := max(H, haOpen, haClose);
haLow := min(L, haOpen, haClose);
[linestyle=Candle; color=Black]
if (haOpen < haClose,haOpen,undefined);
if (haOpen < haClose,haHigh,undefined);
if (haOpen < haClose,haLow,undefined);
if (haOpen < haClose,haClose,undefined);
[linestyle=Candle; color= Black]
If(haOpen >= haClose,haOpen,undefined);
If(haOpen >= haClose,haHigh,undefined);
If(haOpen >= haClose,haLow,undefined);
If(haOpen >= haClose,haClose,undefined);
[linestyle=fill bars; color=Red; width=4.5]
If(haOpen >= haClose,haOpen,undefined);
If(haOpen >= haClose,haClose,undefined); [linestyle=fill bars; color=Lime Green; width=4.5]
If(haOpen <= haClose,haOpen,undefined);
If(haOpen <= haClose,haClose,undefined);
|
Posted By: cmacdon
Date Posted: 19 Sep 2012 at 8:44am
|
Good Jazza ------------- BC User since June 2007 |
Posted By: cmacdon
Date Posted: 19 Sep 2012 at 11:08am
|
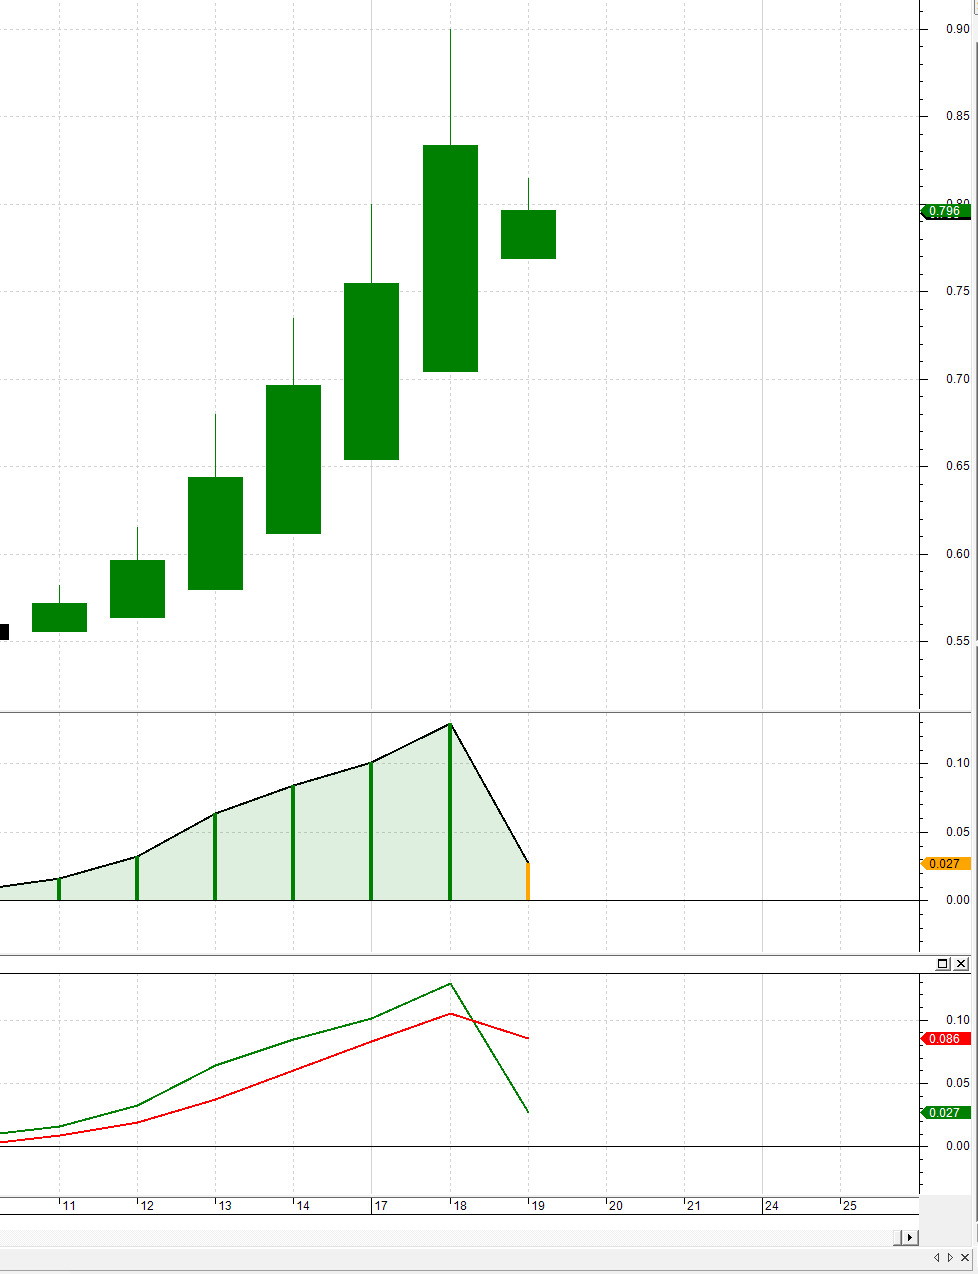
Going back to an earlier post about potential problems using HA bars to trade EOD or longer, and also the use of HA Delta or my HA Oscillator here is a good example of the issue from today's market. At 10.30 a.m. approx AQP has dropped 12% from yesterdays high and 8% from Yesterdays Close yet the HA bar is still showing Green for an up trend. The First chart shows the OHLC bars and the next charts shows the incorrect trend indication on the last HA bar at the same point in time On the other hand, the Oscillator has picked up the change as it is coloured yellow showing a move down from a green bar indicating a decine from a maxima, and the HA Delta is showing a cross over. 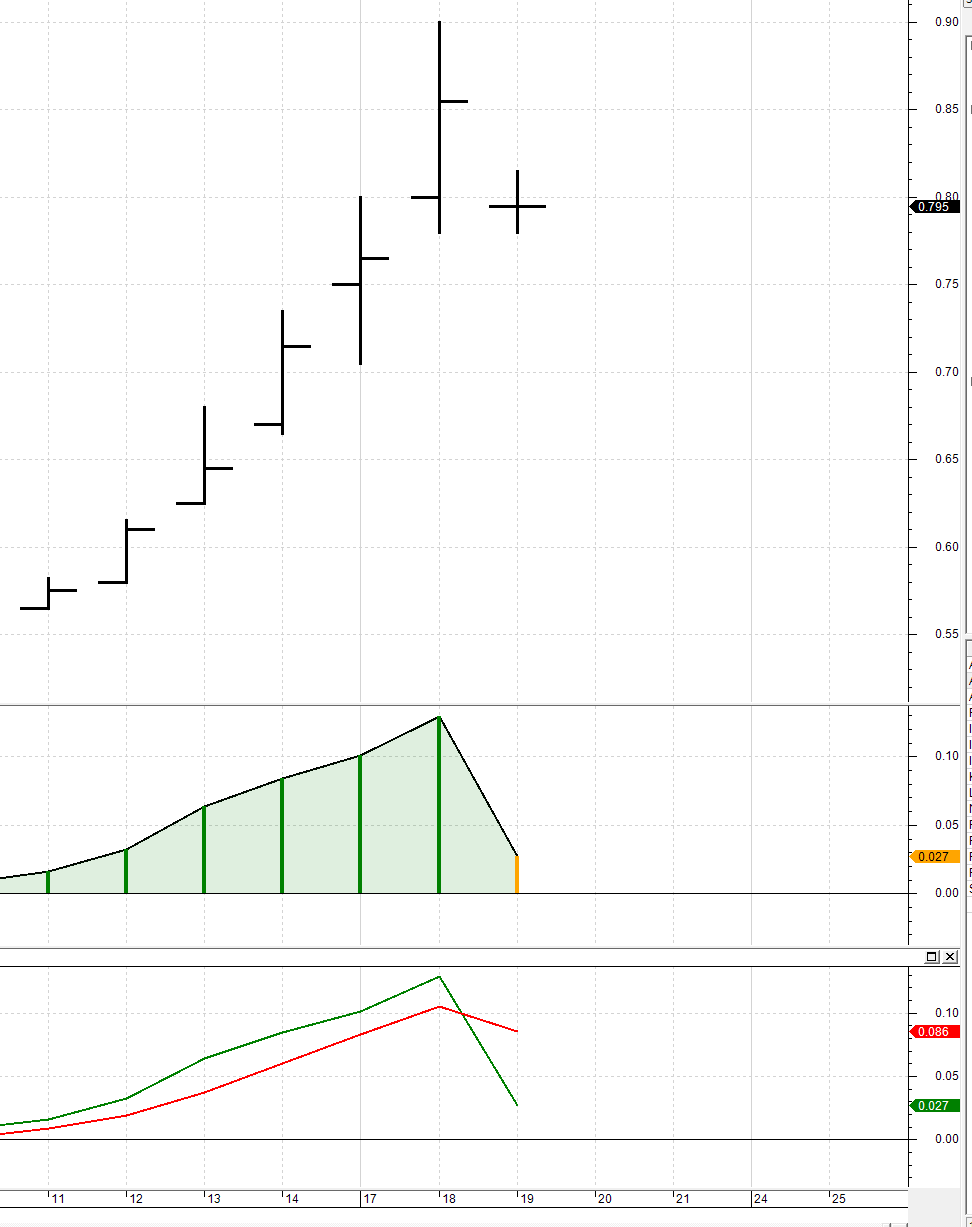 ------------- BC User since June 2007 |
Posted By: cmacdon
Date Posted: 19 Sep 2012 at 11:09am
 ------------- BC User since June 2007 |
Posted By: jazza
Date Posted: 19 Sep 2012 at 1:54pm
|
Hi Cmacdon, Interesting point re HA. I have been looking at the HA delta(3) and have come to the conclusion that it is gives too many false signals. I think you alluded to that in an earlier post. Still think the HA is a great trend trading tool. At the moment, I am combining it with my favorite momentum oscillator, a 7 period RSI |
Posted By: cmacdon
Date Posted: 14 Oct 2012 at 12:58pm
|
Here is a potential fix/improvement to the problem noted above regarding late signals, potential whipsaws or incorrect signals using traditional Heikin Ashi defined bars. The key issue underlying HA bars is a moving average concept. The definition of HaClose is := (
O+H+L+C)/4; and this MA estimate flows into each of the other definitions of HAHigh, HALow and HA Open bars. In a lot of indicators based on moving averages, I tend to always use "pldot" as the moving average definition, as it tends to produce a very smooth MA and, because it is based on the last 3 bars the MA has a built in momentum component. Pldot was invented by Charles Drummond, a Canadian Trader and is the core input to Drummond Geometry Trading approach and software. pldot:=((( hist(h,0)+hist(Low,0)+hist(C,0))/3)+((hist(h,1)+hist(Low,1)+hist(C,1))/3)+((hist(h,2)+hist(Low,2)+hist(C,2))/3))/3; replace the definition of HaClose to - haclose:=pldot, you get the improved charting results I show in the first comparison chart below. On the charts I have noted the potential benefits for trading using HA-pldot bars on the charts as I see them. You can make up your own minds.I used AQP as the security, as it had the problem I noted above in an earlier post when it was still showing a HA up bar when clearly the market had turned. Chart2 is my previous HA coloured bars for comparison purposes showing problematic turning points or potential whipsaw bars. Chart 3 is Maximo's originally defined Heikin Ashi bars. Also showing comparative turning points or potential whipsaws traditional defined HA bars. 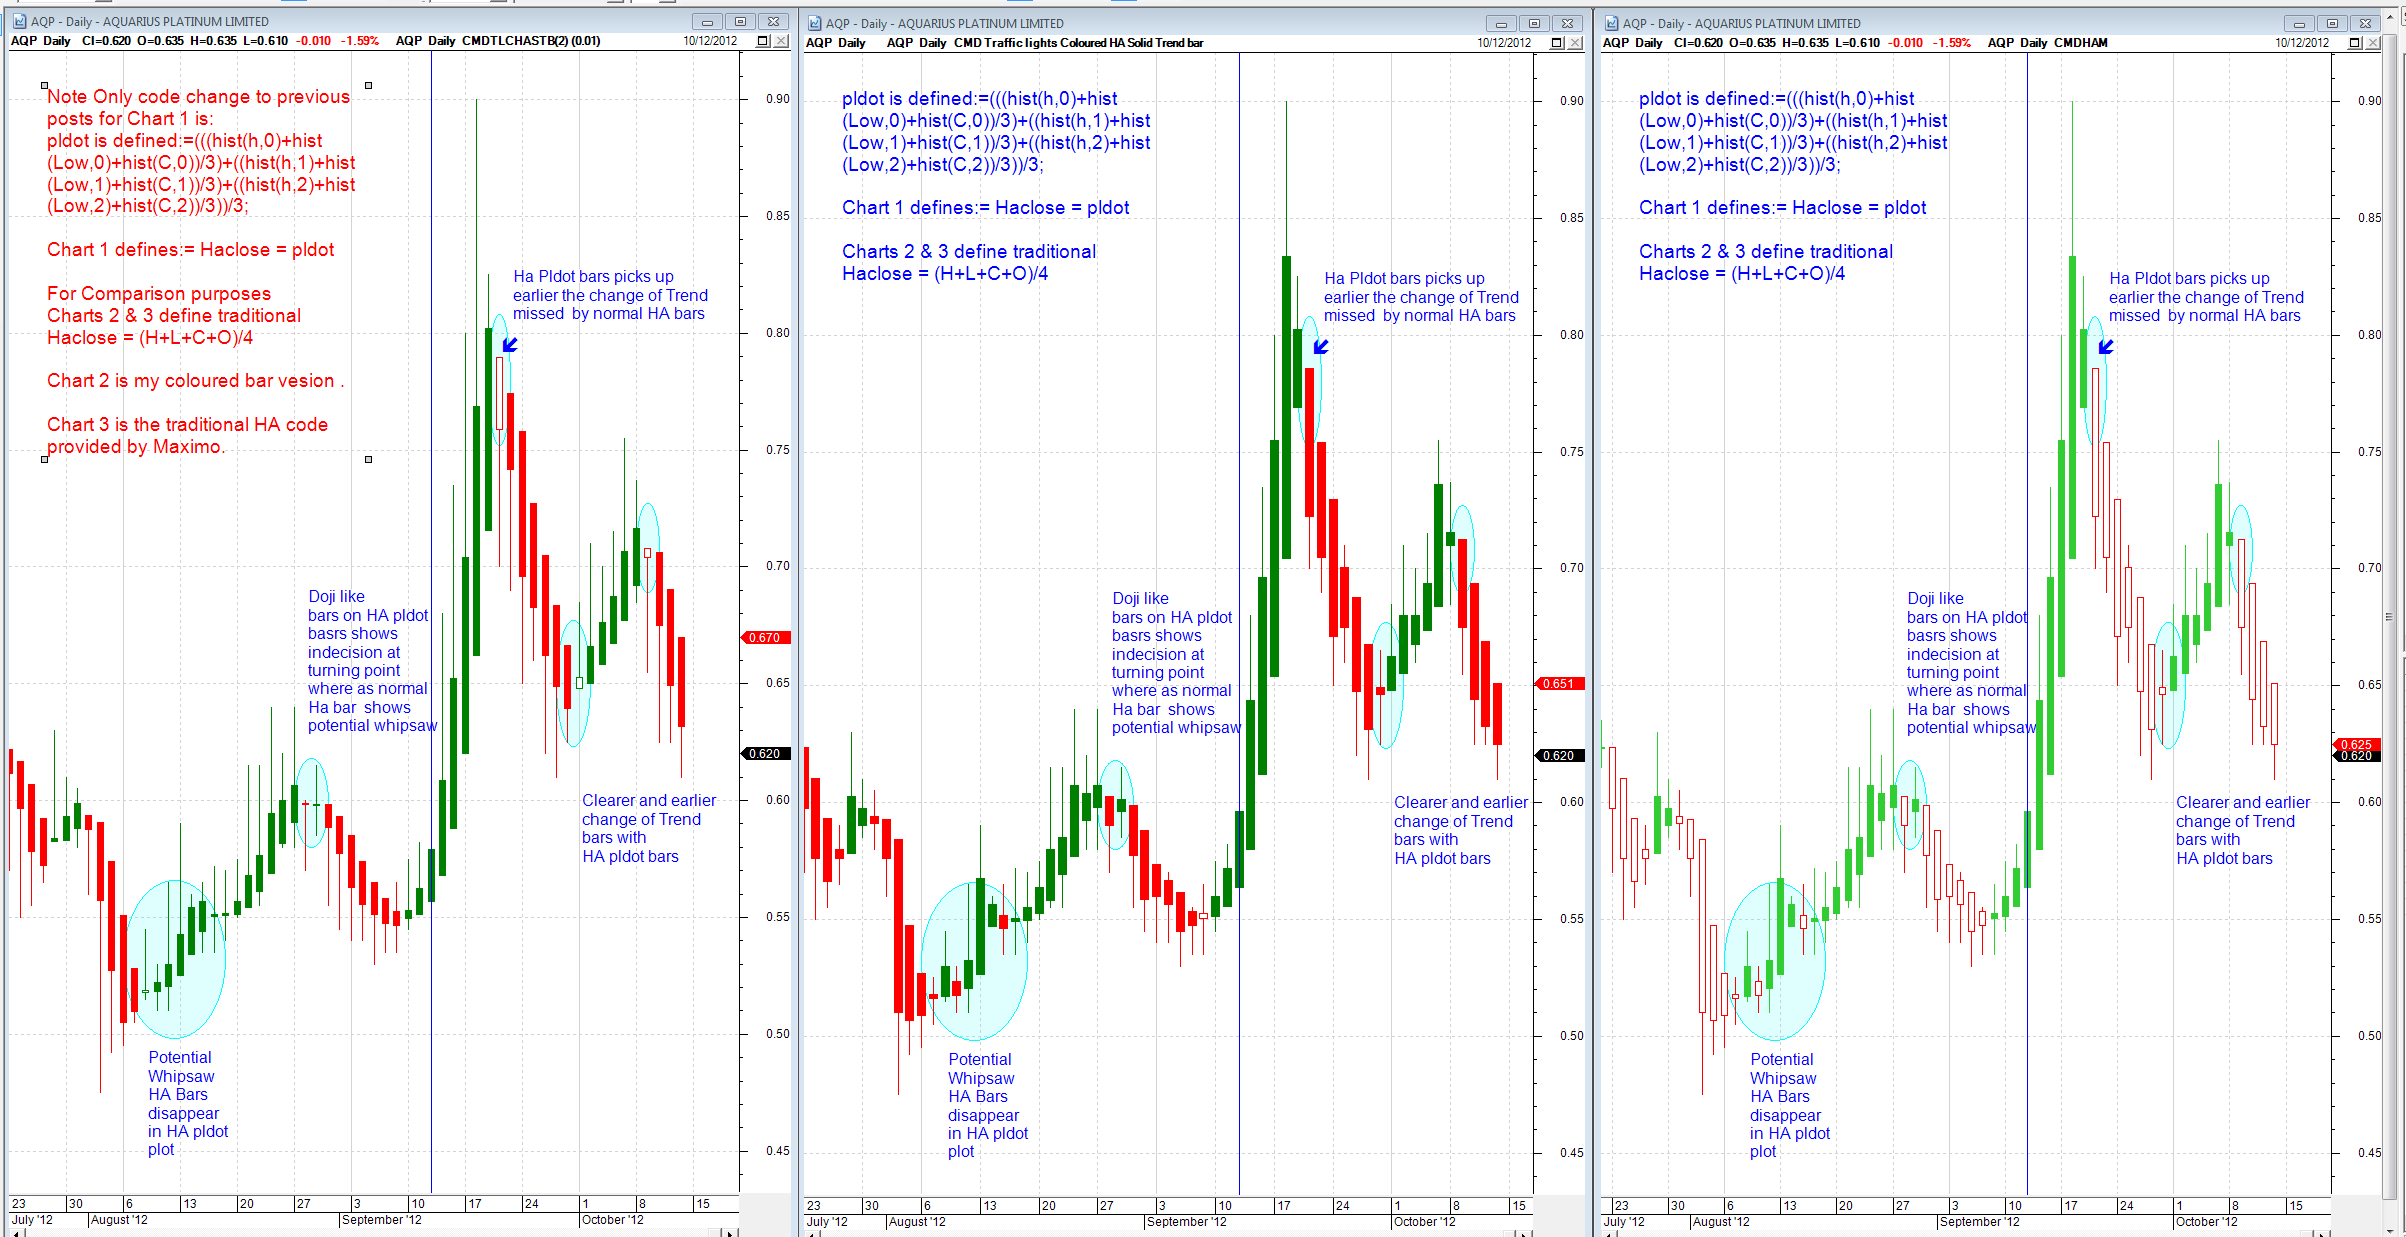 ------------- BC User since June 2007 |
Posted By: cmacdon
Date Posted: 14 Oct 2012 at 8:58pm
|
In this chart, I thought it might be worth comparing how smooth is pldot compared to a couple of other ways to develop similar indicators. Chart 1 is the amended HA-pldot bars with Bollinger bands at 1 and 2 standard deviations where BB is based also on pldot. Chart 2 is traditional HA bars and traditional Bollinger bands calculations based on the close rather than pldot. Chart 3 is similar to t he above but BB is based on Hull Moving average which is one of the fastest MA configurations available. In my view Chart 1 show that a system based on pldot has the edge in providing clearer potential signals. Each 5 min chart is based on 10 period MA. 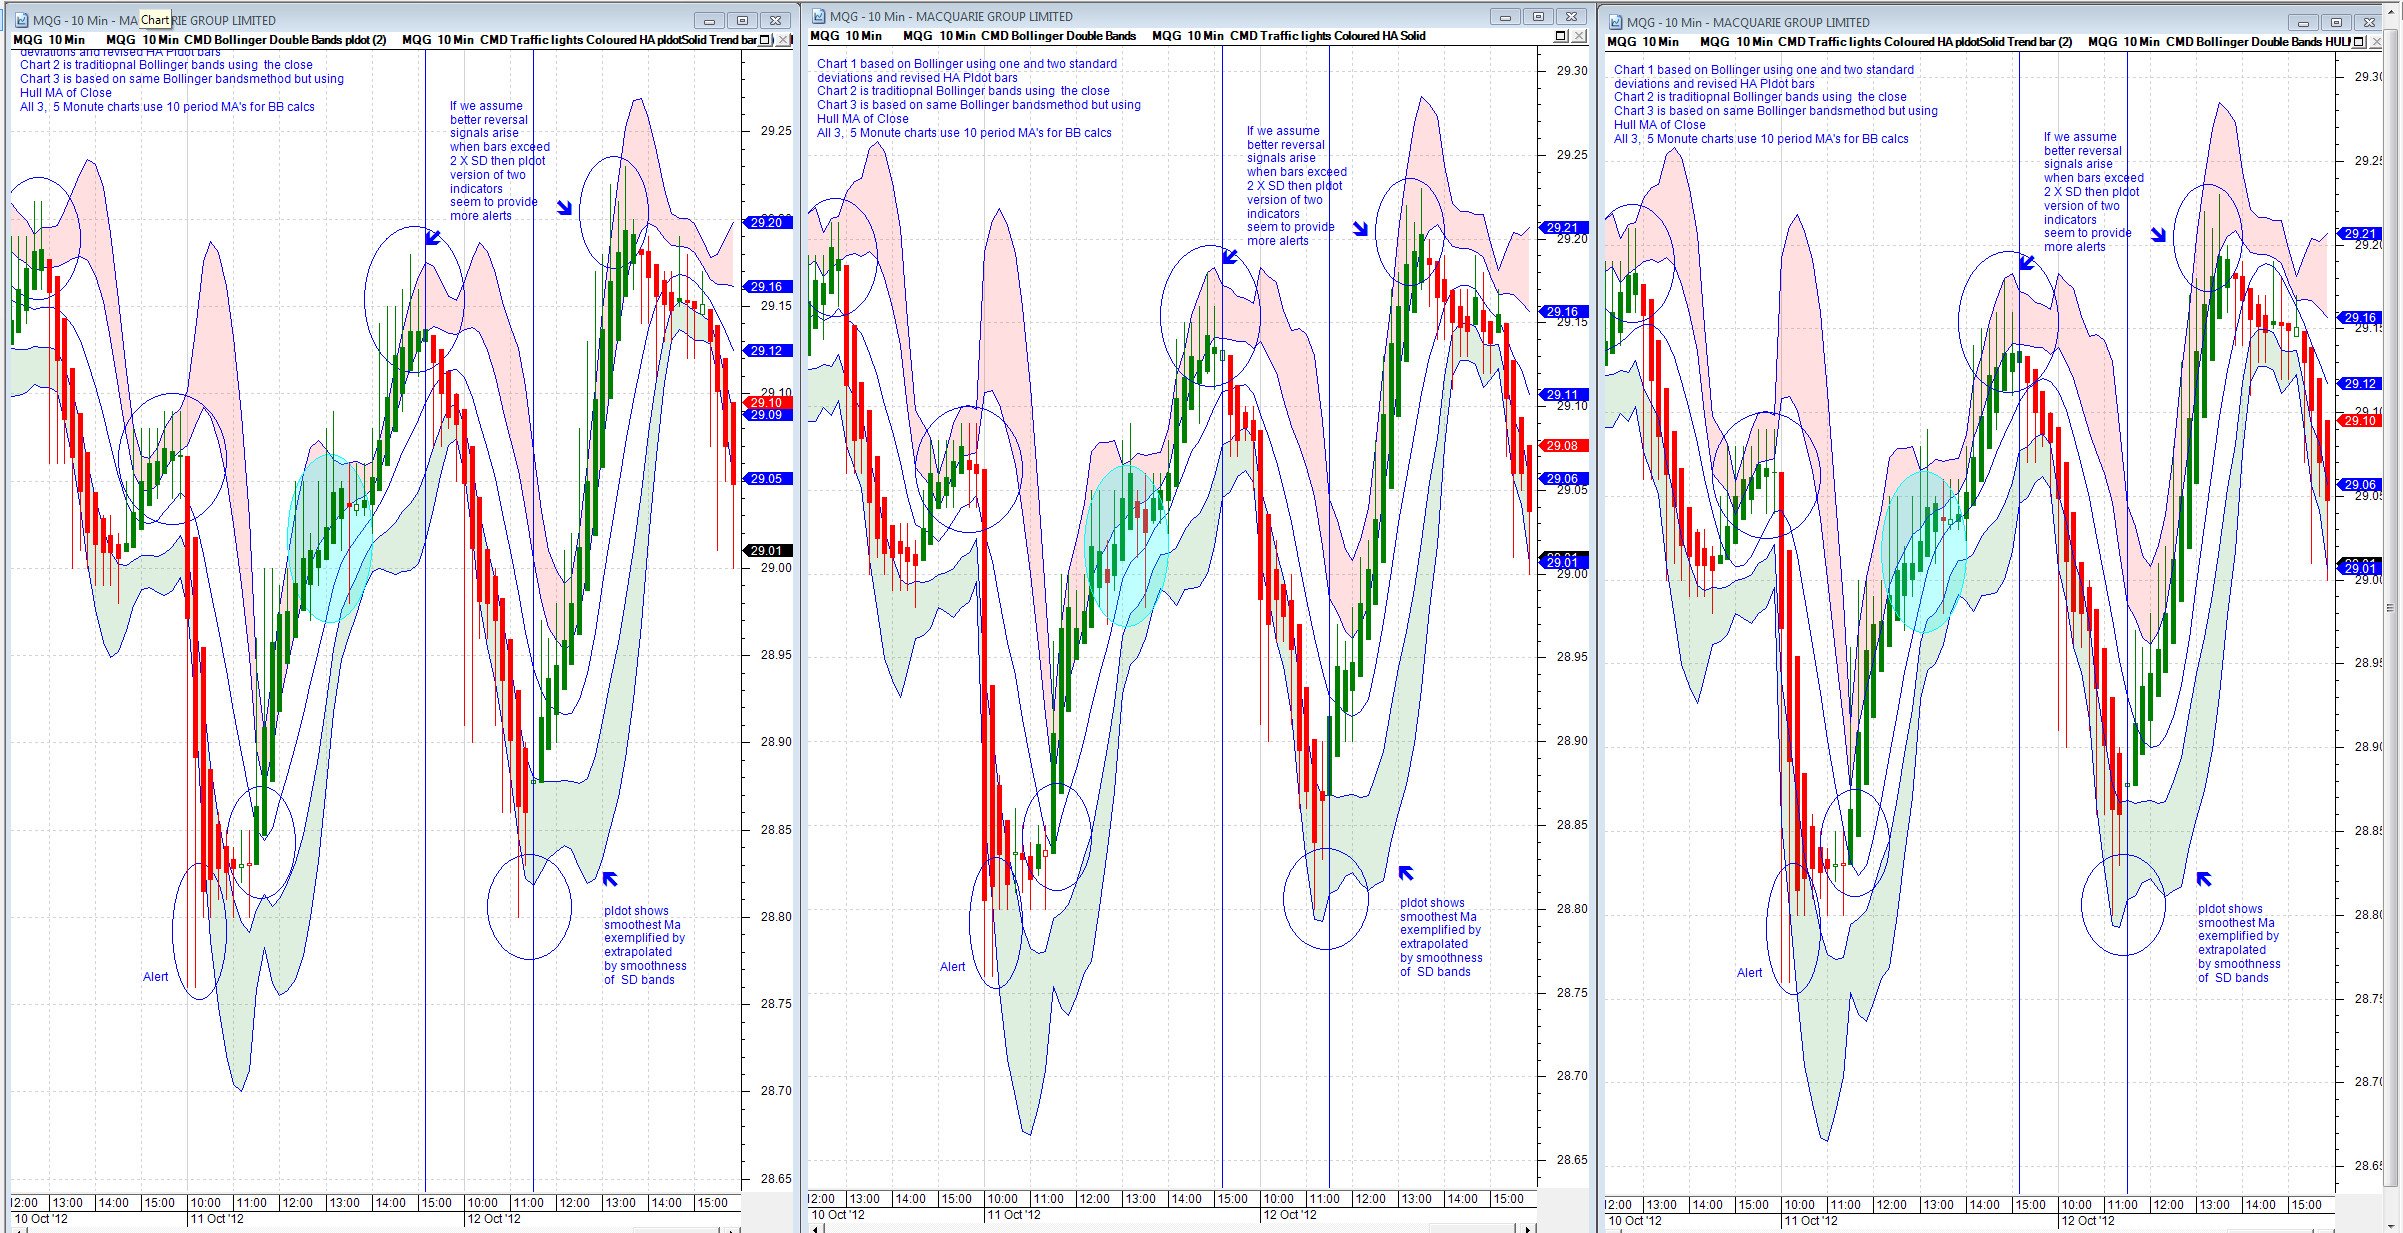 ------------- BC User since June 2007 |
Posted By: cmacdon
Date Posted: 14 Oct 2012 at 11:59pm
|
I just lost a correction post so I will do it again. I withdraw and correct my proposal about using pldot in the HA definition two posts above. After reviewing it in more depth it appear that HA pldot is giving the appearance of improving the turning point but it is in fact picking up the same incorrect bar as the turning point as the original Ha bars showed. Both Ha definitions are picking up the actual second bar after the particula top as the first HA down bar. I will have to keep working at it. Apologies. 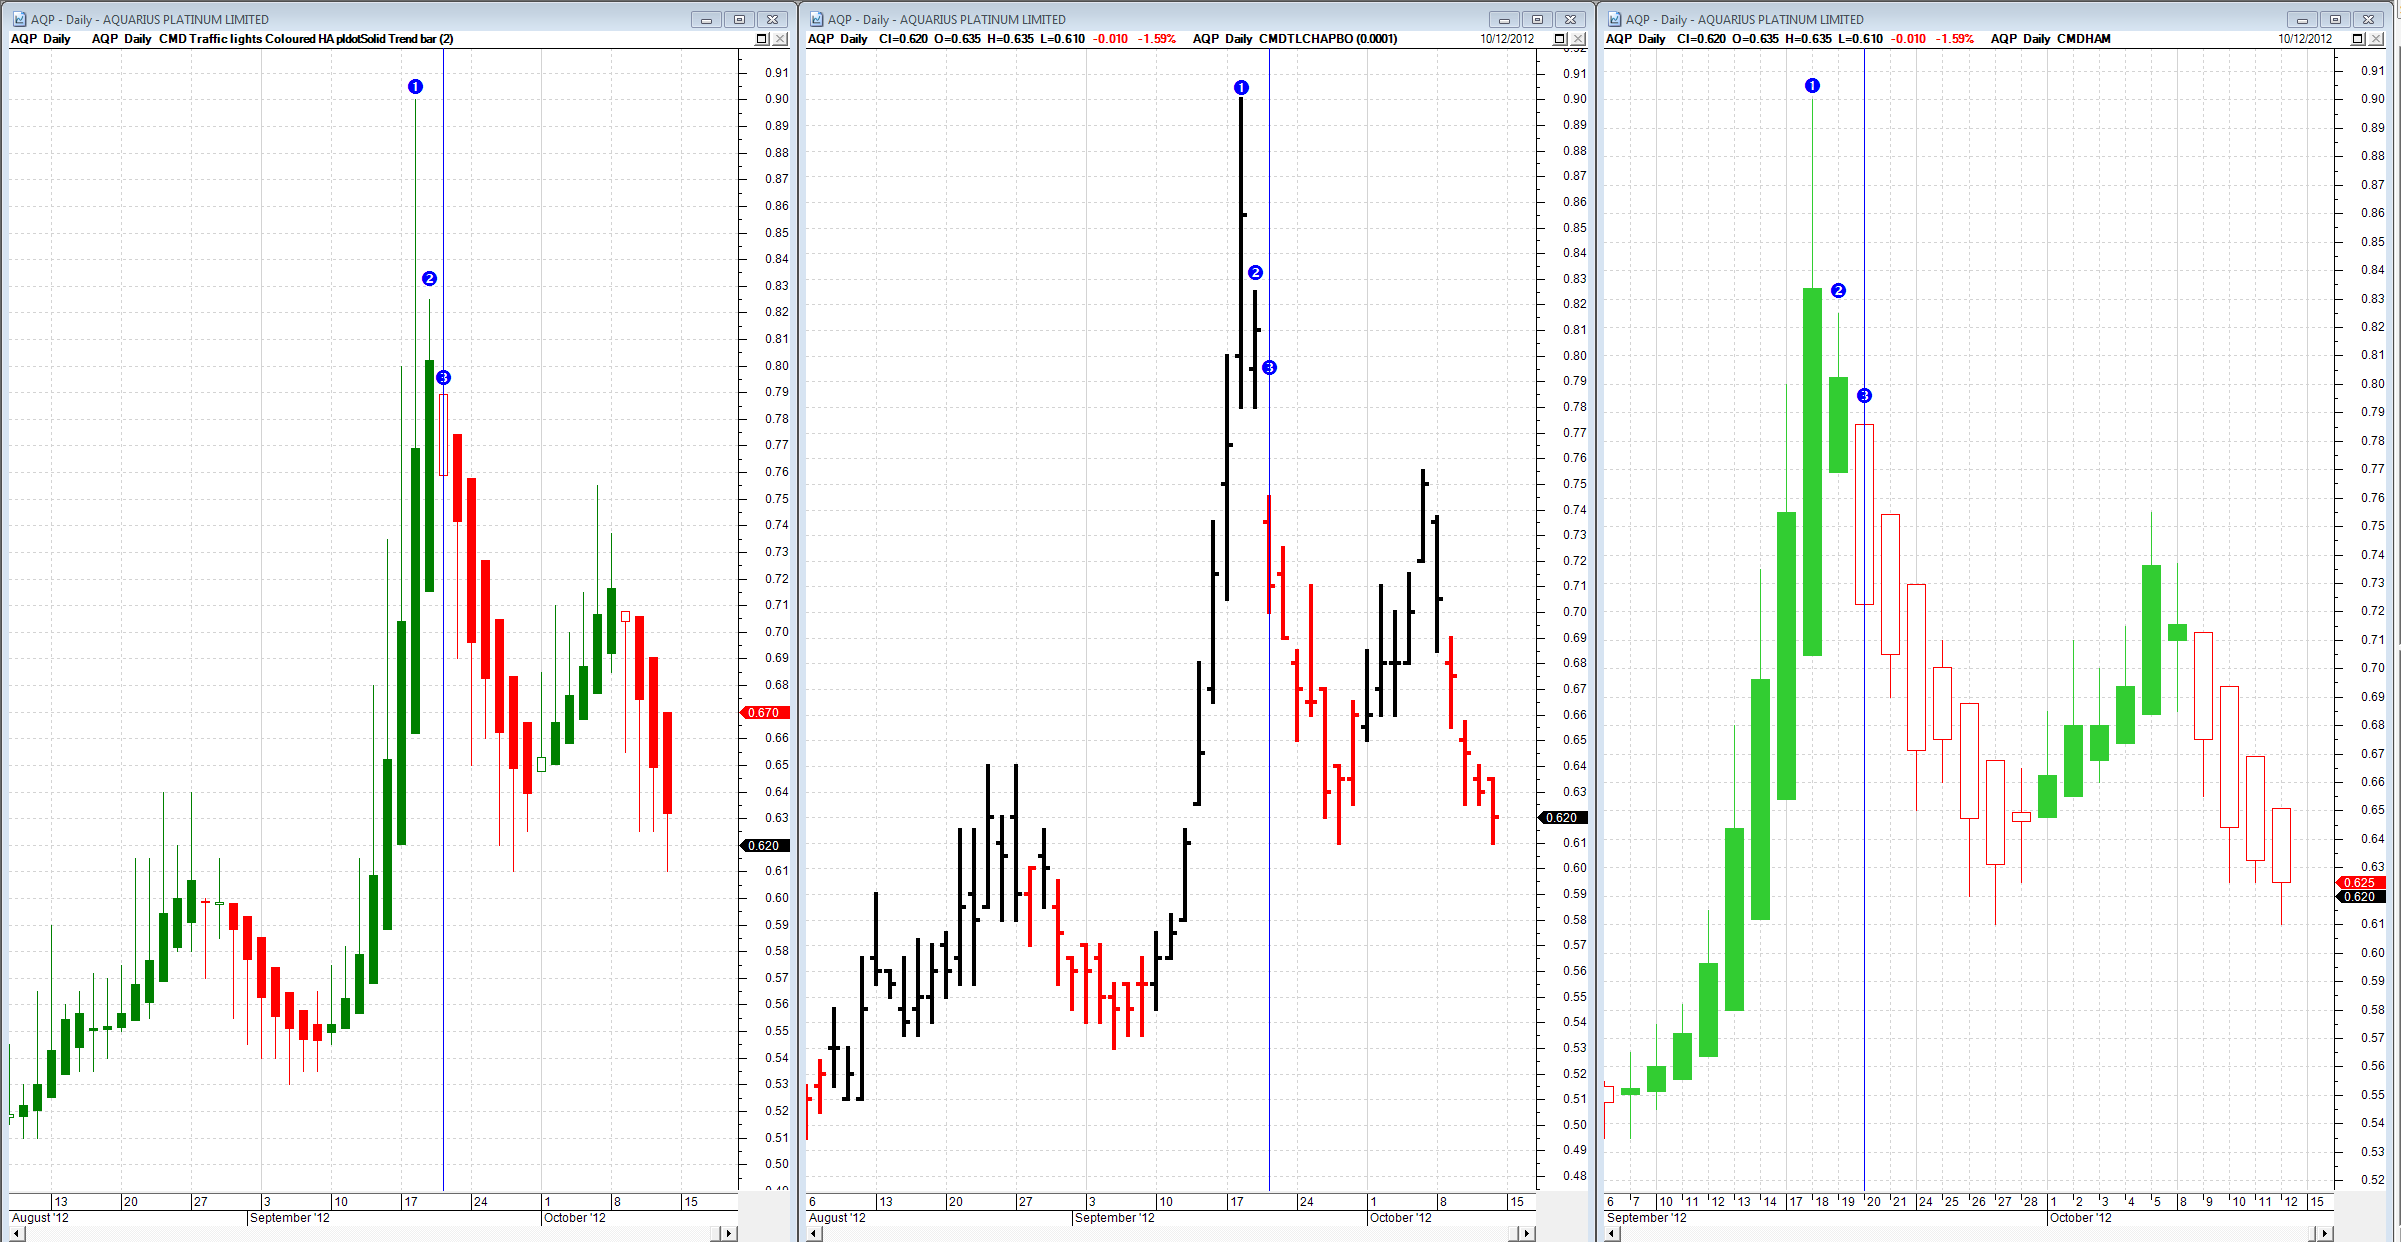 ------------- BC User since June 2007 |
Posted By: cmacdon
Date Posted: 15 Oct 2012 at 11:24am
|
Here is some corrected code to pick up earlier and correctly colour the HA , Ha-Pldot bars. I provided an option to select the traditional haClose definition HaClose:= (O +H+C+L) or pldot. At the bottom of the code I added some exception rules to overcome the probelm of HA bars not picking up changes in trend earl enough at tops and bottoms. This intoduces the possibility of whipsaws but they are more correct as they identify actual down bars in uptrends or actual upbars in down trends when they occue. If you find further exceptions needed it is relatively easy as shown at the bottom of the code to add more exceptions using an Or statement. The exception rules are triggered if you have the 3rd and 4th box ticked in the style menu i.e. Chart 4 below. if the exception rules are not triggered leave those boxes blank. Ticking them on and off gives some insight as to whther synthetic HA bars appear to be correct. 4 charts of AQP for comparison purposes are shown below 1 Original OHLC bars. 2 Original Defined HA code 3 My chart from code shown further below with original HA pldot bars ( exceptions not turned on) 4 Same chart with 3rd and 4th box in style menu turned on. 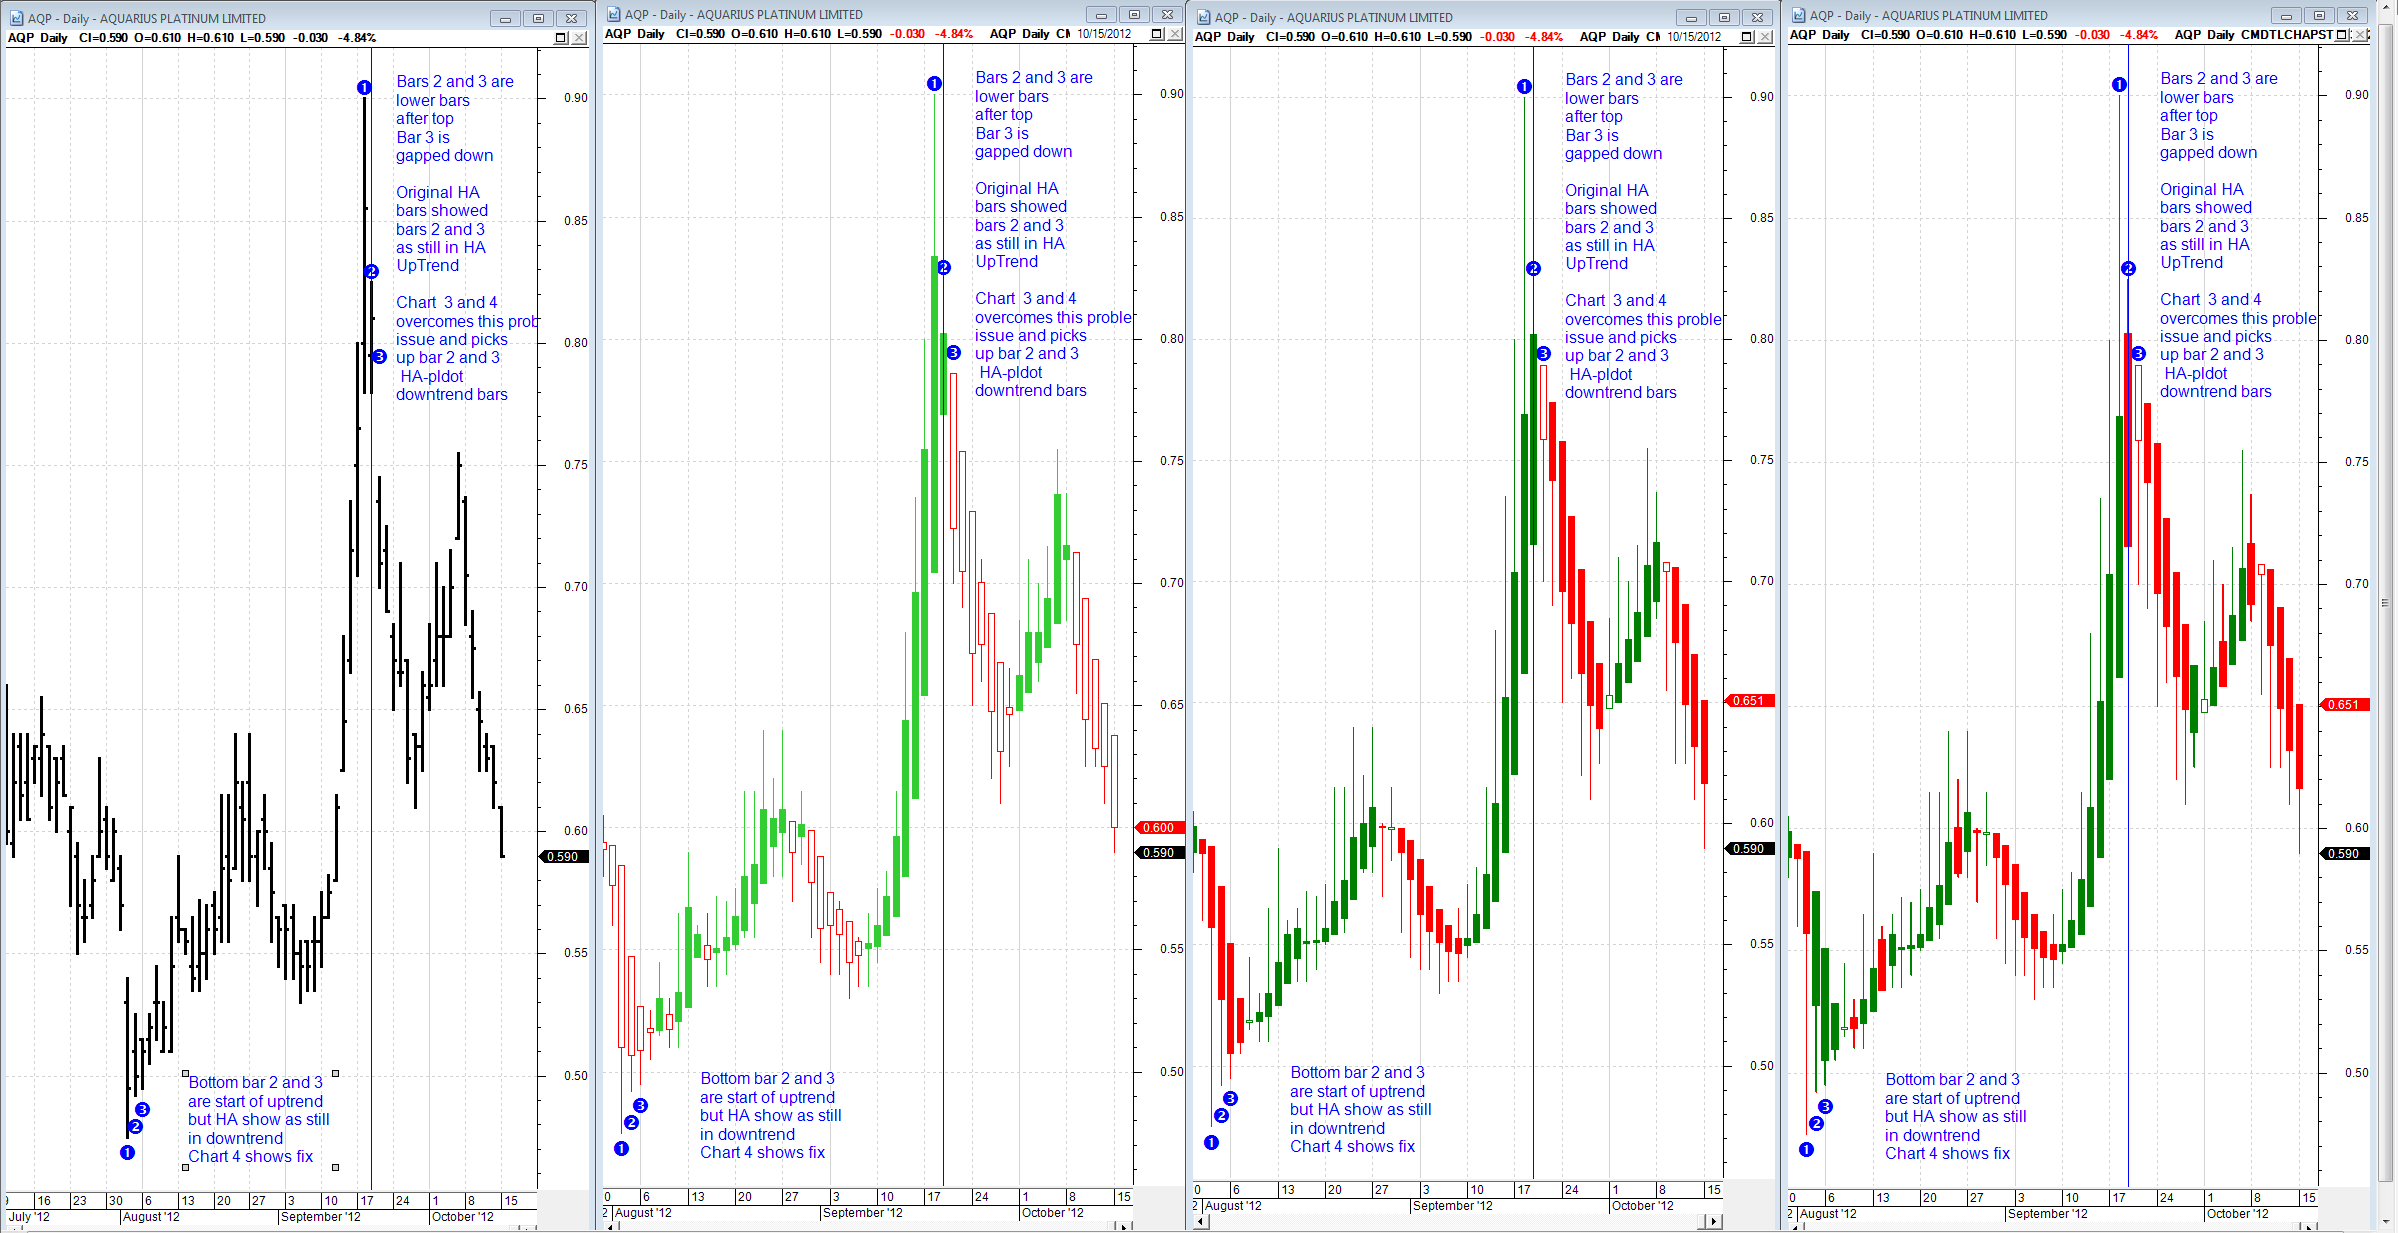 ------------- BC User since June 2007 |
Posted By: cmacdon
Date Posted: 15 Oct 2012 at 11:26am
|
Here is the Bullscript code ----------------------------------------------- [target =Price;] n := input("Define Haclose 1=(O,H,C,L)/4; 2=pldot ",2,1); pldot:=((( hist(h,0)+hist(Low,0)+hist(C,0))/3)+((hist(h,1)+hist(Low,1)+hist(C,1))/3)+((hist(h,2)+hist(Low,2)+hist(C,2))/3))/3; norm:=( O+H+L+C)/4; haClose := if(n=1,norm,pldot); haOpen := ( prev + hist(haClose,1))/2; haHigh := max(H, haOpen, haClose); haLow := min(L, haOpen, haClose); haCl:=(( O+H+L+C)/4+haOpen+Max((O+H+L+C)/4,Max(H,haOpen))+Min((O+H+L+C)/4,Min(L,haOpen)))/4; Greenlight:=Hahigh-(haopen) ; Redlight:=Halow-(haOpen);
{I changed this to a difference to net off the minor congestion amounts to whatever if the largest Traffic light tmeasure. this makes the trends more continuous for the coloured bars} LightDiff:=Greenlight+Redlight; [linestyle =Candle;color=Green; ] If (lightdiff >=0.000, haOpen,undefined); If (lightdiff >=0.000, haHigh,undefined); If (lightdiff >=0.000, haLow,undefined); If (lightdiff >=0.000, haClose,undefined); [linestyle =Candle;color=Red; ] If (lightdiff <=0.000, haClose,undefined); If (lightdiff <=0.000, haLow,undefined); If (lightdiff <=0.000, haHigh,undefined); If (lightdiff <=0.000, haOpen,undefined);
[linestyle =Candle; Width=2; color=Red; ] If (H<Hist(h,1) And Hist(h,1)>=Hist(H,2) AND Hist(h,1)>=Hist(H,3) AND Hist(h,1)>=Hist(H,4), haopen,undefined); If (H<Hist(h,1) And Hist(h,1)>=Hist(H,2) AND Hist(h,1)>=Hist(H,3) AND Hist(h,1)>=Hist(H,4), haLow,undefined); If (H<Hist(h,1) And Hist(h,1)>=Hist(H,2) AND Hist(h,1)>=Hist(H,3) AND Hist(h,1)>=Hist(H,4), haHigh,undefined); If (H<Hist(h,1) And Hist(h,1)>=Hist(H,2) AND Hist(h,1)>=Hist(H,3) AND Hist(h,1)>=Hist(H,4), haClose,undefined);
{To catch second bar at a Bottom turning point} a:= If((L>Hist(L,1) AND Hist(L,1)<=Hist(L,2) AND Hist(L,1)<=Hist(L,3) AND Hist(L,1)<=Hist(L,4) AND C>Hist(c,1)),1, undefined); {To Catch a second incorrect HA bar after a bottom turning point} a2:= If (Hist(a,1) AND L>Hist(L,1)AND C>Hist(c,1) ,1,undefined); {To Catch a third incorrect HA bar after a bottom turning point} a3:= If (Hist(a2,1) AND L>Hist(L,1) AND C>Hist(c,1),1,undefined); [linestyle =Candle; Width=2; color=Green; ] If (a OR a2 OR a3, HaClose,undefined); If (a OR a2 OR a3, HaLow,undefined); If (a OR a2 OR a3, HaHigh,undefined); If (a OR a2 OR a3, Haopen,undefined);
------------- BC User since June 2007 |
Posted By: jazza
Date Posted: 20 Oct 2012 at 4:36pm
|
Hi cmacdon, Some serious coding there and nice adjustments. I have pasted to a new template and will use as an alternative with my old Heikin Ashi for comparison. Thanks very much, cheers |