Heikin - Ashi Candlesticks |
Post Reply 
|
Page <1234 5> |
| Author |
 Printable Version Printable Version Delicious Delicious Digg Digg Facebook Facebook Furl Furl Google Boomarks Google Boomarks Google Buzz Google Buzz MySpace MySpace Newsvine Newsvine reddit reddit StumbleUpon Translate StumbleUpon Translate Twitter Twitter Windows Live Windows Live Yahoo Bookmarks Yahoo Bookmarks Topic Search Topic Search  Topic Options Topic Options
|
jazza 
Regular 

Joined: 10 Aug 2007 Posts: 33 |
 Post Options Post Options
 Quote Reply Quote Reply
 Posted: 19 Sep 2012 at 1:39am Posted: 19 Sep 2012 at 1:39am |
|
Maximo, got me thinking with your “fill attribute”. Had a fiddle with your formula and managed to get the candles filled but with the black outline and wicks for a crisper look. [citation="'Using The Heikin-Ashi Technique', by Dan Valcu Stocks & Commodities Feb 2004 www.traders.com"]
[target=Price]
haClose := (O+H+L+C)/4;
haOpen := (prev + hist(haClose,1))/2;
haHigh := max(H, haOpen, haClose);
haLow := min(L, haOpen, haClose);
[linestyle=Candle; color=Black]
if (haOpen < haClose,haOpen,undefined);
if (haOpen < haClose,haHigh,undefined);
if (haOpen < haClose,haLow,undefined);
if (haOpen < haClose,haClose,undefined);
[linestyle=Candle; color= Black]
If(haOpen >= haClose,haOpen,undefined);
If(haOpen >= haClose,haHigh,undefined);
If(haOpen >= haClose,haLow,undefined);
If(haOpen >= haClose,haClose,undefined);
[linestyle=fill bars; color=Red; width=4.5]
If(haOpen >= haClose,haOpen,undefined);
If(haOpen >= haClose,haClose,undefined); [linestyle=fill bars; color=Lime Green; width=4.5]
If(haOpen <= haClose,haOpen,undefined);
If(haOpen <= haClose,haClose,undefined);
|
|
 |
|
|
cmacdon
BullCharts Guru 
Joined: 09 Sep 2012 Location: Brisbane Posts: 236 |
Post Options
Quote Reply
Posted: 17 Sep 2012 at 7:21pm |
|
JazzaIf you are interested, the last chart posted in the Volume Spread Analysis posts now shows solid trend colours in the body of the HA bars, and the VSA relative volume colurs as the tails and Ha bars outline.
|
|
|
BC User since June 2007
|
|
|
|
|
cmacdon
BullCharts Guru
Joined: 09 Sep 2012 Location: Brisbane Posts: 236 |
Post Options
Quote Reply
Posted: 17 Sep 2012 at 1:43pm |
|
Jazza Thanks for the image posting advice, I copied two charts at the bottom of the VSA Thread which are my normal VSA coloured screen and also a Heikin Ashi Bars coloured version according to my interpretation of VSA relative volume. The inidcator is an amalgamation of my last Solid colour HA bars above and the coloured VSA volume bars I previously posted on the VSA post section. It is interesting in that the reversal bar small body and large tails at the bottom of the screen really sticks out in red because it had Ultrahigh volume, whereas just looking at HA consolidation or congestion bars in one or two colours may not have alerted one that this may have been a major this was a turning point. It is Tom Williams, the inventor of VSA point, that narrow spreads with Ultra High Volume indicates smart money is active.
|
|
|
BC User since June 2007
|
|
|
|
|
jazza
Regular
Joined: 10 Aug 2007 Posts: 33 |
Post Options
Quote Reply
Posted: 16 Sep 2012 at 9:11pm |
|
Hi Cmacdon, Agreed re many of the books out there. However of course there are some gems out there. For instance, my Thomas Bulkowski books on chart Patterns and Candlesticks are like Encyclopedia reference books! Thanks for your evaluation of the Vervoort book. He has lots of info and videos on his web site so may just look at those and avoid. Might think about the Valcu book. I do have his “Stocks and Commodities” article which gives the 5 rules. Re the graphics, the site can be a bit flakey. For adding Graphics ,JPS’s etc don’t use the quick reply box. Use the “Post Reply” Box with the blue arrow, this will bring up the message box below. Some times the top row of Icons are unreadable and the page has to be refreshed. For my previous post it would not up load in Firefox so I retried in Crome and it worked, so go figure. Cheers Jazza 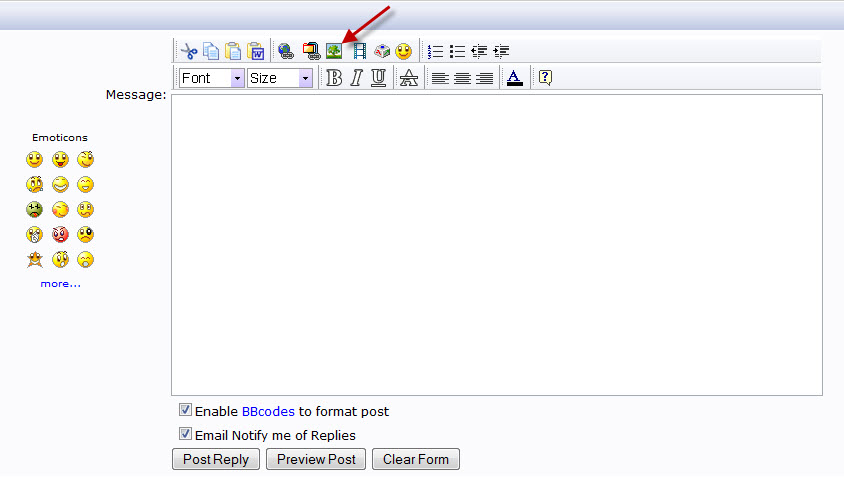 |
|
|
|
|
jazza
Regular
Joined: 10 Aug 2007 Posts: 33 |
Post Options
Quote Reply
Posted: 16 Sep 2012 at 8:57pm |
|
|
|
|
|
|
cmacdon
BullCharts Guru
Joined: 09 Sep 2012 Location: Brisbane Posts: 236 |
Post Options
Quote Reply
Posted: 16 Sep 2012 at 4:58pm |
|
Just noticed, must be a good week as I joined the forum last week to discuss a few things I was interested in and I have been promoted from a newbie to a regular by the system. I need to go back into my shell.
|
|
|
BC User since June 2007
|
|
|
|
|
cmacdon
BullCharts Guru
Joined: 09 Sep 2012 Location: Brisbane Posts: 236 |
Post Options
Quote Reply
Posted: 16 Sep 2012 at 4:37pm |
|
Jazza
Like most trading books I have and there are many on shelves behind me, I tend to read them only once and do not reread them again unless they are really focused onto something that is fundamental to understanding a particular aspect of trading or the market process that is useful to me. In other words, the books need to be really focused and with some depth thereon to a particular issue before I would reread. (There are numerous light weight books out there that are that are focused on reexplaining MACD, RSI and maybe stochastics? They tend to be repetitive and at the end of the day thoroughly boring.) In my opinion, Vervoort's book tries to cover too much ground in one book. He expalins HA bars , and covers his SVAPO oscillator system and "Lockitt"which is the name of his trading methodology but this entails covering Heikin Ashi, and Candlesticks (of which there are many other books) and Elliott waves (of which there are too too many other books) and Risk Management ( of which there are many other books), Babson and Pitchforks, resistance levels and Fibbonnacci etc. I only referred to his book in my post as I wanted to compare whether his uptrends and down trend HA bars were the same black and white direction as shown in Falcu's book cited earlier, and your suggestion that Bullcharts was back to front. Personally it does not matter to me which way the colours or B&W) go as long as they are consistenlt the same way. I do not know if you have it but, Part One (Chapters 1-7) of Falcu's book is good as he focuses purely on explaining HA, and the table on page 22 is particularly useful as it gives you the 5 rules for translating HA bars so you can trade them. The rest of the book compares the HA approach to candlesticks, moving averages, ichimoku, market breadth , pivotts and Forex. So I might reread Section one from time to time. Hope that helps By the way how do you post graphics on your posst as I tried to post a graphic of a chart the other day and the forum pst reply process did not accept the graphic.
|
|
|
BC User since June 2007
|
|
|
|
|
jazza
Regular
Joined: 10 Aug 2007 Posts: 33 |
Post Options
Quote Reply
Posted: 16 Sep 2012 at 2:05pm |
|
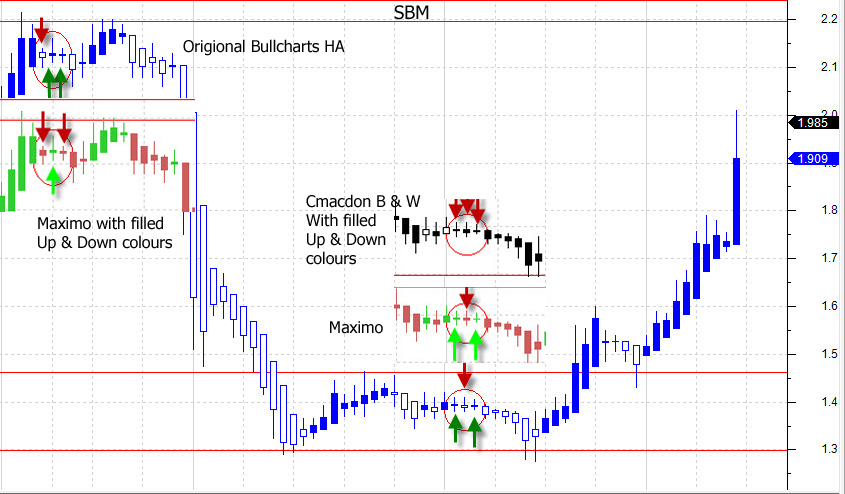
Hi Cmacdon and Maximo, Hearty congrats, great effort. Very happy with these solutions. Sorry about the late reply but immediately noticed some visual anomalies that I wanted to figure out first. Noticed that some of the close priced congestion bars differed in trend between the different solutions as per the super imposed screen shot below. The answer is easy once you know but it took me some time to figure out. Zooming the page corrects the candle Up/Down anomalies. I put the formula into an excel spread sheet and it checked out. I also carefully checked the price of the HA candle with the Crosshair under zoom and they were correct. The HA formula alters all the OHLC prices to 3 decimal point increments at different times. In respect to the Origional Bullcharts HA formula, when the Candle bodies are small, unfilled candles do not visually cope with these fractions and can be filled under normal unzoomed conditions. When you are looking at the “Hard Right Edge” of the chart I think this is Important. Certainly Maximo, love your solid fill Up/Down color solution as it solves any ambiguity as to whether the HA bars have closed up or down in narrow ranges. Cmacdon, as a Black and White candlestick traditionalist, I also love you’re your solution. Just gotta remember to zoom in with congestion bars if you are concerned about the correct open or close. Thanks guys, Cheers. PS: Cmacdon, figure from previous comments that you may have the Sylvain Vervoort book “Capturing profit with technical analysis” Worth buying in your opinion?
|
|
|
|
|
cmacdon
BullCharts Guru
Joined: 09 Sep 2012 Location: Brisbane Posts: 236 |
Post Options
Quote Reply
Posted: 15 Sep 2012 at 10:46am |
|
Serendipidy never ends! Maybe a third indicator. I just changed the above code for the congestion bars section as shown below and this produced all trend up bars in White and all down trend in black which is the way they are shown in Valcu's book mentioned earlier and also in Sylvain Vervoort "Capturing Profit with Technical analysis, Market Place Books 2009; and I think Jazza alternative to colour requirement.[linestyle =Candle;color=Black; ] If (Greenlight >=0.000 and Redlight <=-0.000, haClose,undefined); If (Greenlight >=0.000 and Redlight <=-0.000, haLow,undefined); If (Greenlight >=0.000 and Redlight <=-0.000, haHigh,undefined); If (Greenlight >=0.000 and Redlight <=-0.000, haOpen,undefined); |
|
|
BC User since June 2007
|
|
|
|
|
cmacdon
BullCharts Guru
Joined: 09 Sep 2012 Location: Brisbane Posts: 236 |
Post Options
Quote Reply
Posted: 15 Sep 2012 at 10:25am |
|
Jazza and MaximoHere they are. I went back to my original code and played around with the order of Ha definitions in the Down trend bars and after similar trial and error the solid colours worked and the proper tails are shown on both up and down Ha bars (The order needs to be Haclose at top and Ha open at the bottom in between hahigh and ha low can be any order. I retried this ranking on partial solution code sent earlier but that did not remedy the down tail problem on earlier post).
There are two indicators below the solid colour trends (doesn't distinguish congestion bars and the second indicator showing the congestion bars in Black ( For some unknown reason in the second indicator when I distinguish the congestion bars in black the congestion bars appear as either white or black solid bodies. That does not matter if you are using the first indicator). 1 is solid colour HA trend indicator 2 is the same but with the congestion bars in black ---------------------------------------------------------------------------------------- [target =Price;] haClose := ( O+H+L+C)/4; haOpen := ( prev + hist(haClose,1))/2; haHigh := max(H, haOpen, haClose); haLow := min(L, haOpen, haClose); haCl:=(( O+H+L+C)/4+haOpen+Max((O+H+L+C)/4,Max(H,haOpen))+Min((O+H+L+C)/4,Min(L,haOpen)))/4; Greenlight:=Hahigh-haopen; Redlight:=Halow-haOpen; {I changed this to a difference to net off the minor congestion amounts to whatever if the largest Traffic light tmeasure. this makes the trends more continuous for the coloured bars} LightDiff:=Greenlight+Redlight;
[linestyle=Candle;color=Green; ] If (lightdiff >=0.000,haOpen,undefined); If (lightdiff >=0.000, haHigh,undefined); If (lightdiff >=0.000, haLow,undefined); If (lightdiff >=0.000, haClose,undefined); [linestyle =Candle;color=Red; ] If (lightdiff <=0.000, haClose,undefined); If (lightdiff <=0.000, haLow,undefined); If (lightdiff <=0.000, haHigh,undefined); If (lightdiff <=0.000,haOpen,undefined);
{end of indicator1} [target =Price;] haClose := ( O+H+L+C)/4; haOpen := ( prev + hist(haClose,1))/2; haHigh := max(H, haOpen, haClose); haLow := min(L, haOpen, haClose); haCl:=(( O+H+L+C)/4+haOpen+Max((O+H+L+C)/4,Max(H,haOpen))+Min((O+H+L+C)/4,Min(L,haOpen)))/4; Greenlight:=Hahigh-haopen; Redlight:=Halow-haOpen; {I changed this to a difference to net off the minor congestion amounts to whatever if the largest Traffic light tmeasure. this makes the trends more continuous for the coloured bars} LightDiff:=Greenlight+Redlight;
[linestyle=Candle;color=Green; ] If (lightdiff >=0.000,haOpen,undefined); If (lightdiff >=0.000, haHigh,undefined); If (lightdiff >=0.000, haLow,undefined); If (lightdiff >=0.000, haClose,undefined); [linestyle =Candle;color=Red; ] If (lightdiff <=0.000, haClose,undefined); If (lightdiff <=0.000, haLow,undefined); If (lightdiff <=0.000, haHigh,undefined); If (lightdiff <=0.000,haOpen,undefined); [linestyle =Candle;color=Black; ] If (Greenlight >0.000 and Redlight <-0.000, haClose,undefined); If (Greenlight >0.000 and Redlight <-0.000, haLow,undefined); If (Greenlight >0.000 and Redlight <-0.000, haHigh,undefined); If (Greenlight >0.000 and Redlight <-0.000, haOpen,undefined); |
|
|
BC User since June 2007
|
|
|
|
|
Post Reply
|
Page <1234 5> |
| Forum Jump | Forum Permissions You cannot post new topics in this forum You cannot reply to topics in this forum You cannot delete your posts in this forum You cannot edit your posts in this forum You cannot create polls in this forum You cannot vote in polls in this forum |