Heikin - Ashi Candlesticks |
Post Reply 
|
Page <1 2345> |
| Author |
 Printable Version Printable Version Delicious Delicious Digg Digg Facebook Facebook Furl Furl Google Boomarks Google Boomarks Google Buzz Google Buzz MySpace MySpace Newsvine Newsvine reddit reddit StumbleUpon Translate StumbleUpon Translate Twitter Twitter Windows Live Windows Live Yahoo Bookmarks Yahoo Bookmarks Topic Search Topic Search  Topic Options Topic Options
|
jazza 
Regular 

Joined: 10 Aug 2007 Posts: 33 |
 Post Options Post Options
 Quote Reply Quote Reply
 Posted: 11 Sep 2012 at 10:46pm Posted: 11 Sep 2012 at 10:46pm |
|
Hi Cmacdon, Nice addition to the Heikin-Ashi. Interesting points you make. I am very new to Heikin -Ashi, but love the way it filters out the noise and shows the trend. At this stage I am using it in conjunction with normal candlesticks for the more specific price action and gaps that you are pointing out.
I tried the candlestick overide on the Bullcharts and some more fiddles with the formula but still can't get those pesky down candles to fill! As always, thanks for your contributions and help. Cheers |
|
 |
|
|
cmacdon
BullCharts Guru 
Joined: 09 Sep 2012 Location: Brisbane Posts: 236 |
Post Options
Quote Reply
Posted: 11 Sep 2012 at 6:58pm |
|
Set out below is another Heikin Ashi "related" indicator that shows and colours actual bars according to the relevant HA bar that would have been superimposed over it. The memorandum at the top of the indicator code explains why I have found it to be more appropriate for for use in actula trading EOD or longer tradingperids.
It may help overcome tje earlier issue oif showiung fills on candlestick bars as it can be used to colours OHLC bars as well as normal candlesticks. ------------------------------------------------------------------------------------- {Heikin-Ashi is fine for trading intraday as gaps
between actual bars are usually minimal intraday. However, one of the potential
drawbacks when trying to trade end of day (or longer) is that the
"synthetic" Ha bars bars drawn
over actual bars look good on a chart but in trading reality it may be
difficult to get order fills or be exact in order placementusing Ha Bars (you cannot get an order
fill within a gap which is often absore3d into a HA bar). A "work
around" is to colour real bars with the colour of a relevant HA bar. This methods expose the gaps between real price bars.
This indicator attempts to do that. For this indicator, congestion bars are absorbed into
up or down HA colours.} [target=Price; linestyle=PriceColor] haClose
:= (O+H+L+C)/4; haOpen
:= (prev + hist(haClose,1))/2; haHigh
:= max(H, haOpen, haClose); haLow
:= min(L, haOpen, haClose); haCl:=((O+H+L+C)/4+haOpen+Max((O+H+L+C)/4,Max(H,haOpen))+Min((O+H+L+C)/4,Min(L,haOpen)))/4; Greenlight:=Hahigh-haopen; Redlight:=Halow-haOpen; { Inetted off the Traffic lights bars to give longer
trends instead of the showing congestion bars} Difflight:=Greenlight+Redlight; [color=Green; name=Trendup] Difflight
>=0.000; [color=Red; name=TrendDown] Difflight
<=0.000; |
|
|
BC User since June 2007
|
|
|
|
|
jazza
Regular
Joined: 10 Aug 2007 Posts: 33 |
Post Options
Quote Reply
Posted: 11 Sep 2012 at 3:45pm |
|
Works a treat. Thanks also for the explanation re your other indicators from yesterday. As always, very much appreciate your help. Cheers |
|
|
|
|
Gordon7
Newbie 

Joined: 09 Sep 2012 Location: Sydney Posts: 6 |
Post Options
Quote Reply
Posted: 11 Sep 2012 at 7:46am |
|
Thanks cmacdon, it matches the haDelta as it appears on the sample charts on the educofin website.
It's the same as your oscillator but with a 3 day simple moving average overlaid. |
|
|
|
|
cmacdon
BullCharts Guru
Joined: 09 Sep 2012 Location: Brisbane Posts: 236 |
Post Options
Quote Reply
Posted: 11 Sep 2012 at 7:44am |
|
incidentally, the first indicator I sent through yesterday is the same as haDelta with out the 3 day Ma of Delta.
haDelta is effectively the body of a ha bar without the tails.
|
|
|
BC User since June 2007
|
|
|
|
|
cmacdon
BullCharts Guru
Joined: 09 Sep 2012 Location: Brisbane Posts: 236 |
Post Options
Quote Reply
Posted: 11 Sep 2012 at 7:28am |
|
I dug this out of my archived indicators
I think ha Delta is haclose -haOpen otherwise you get an inverted oscilator. haClose := ( O+H+L+C)/4; haOpen := ( prev + hist(haClose,1))/2; haHigh := max(H, haOpen, haClose); haLow := min(L, haOpen, haClose); haCl:=(( O+H+L+C)/4+haOpen+Max((O+H+L+C)/4,Max(H,haOpen))+Min((O+H+L+C)/4,Min(L,haOpen)))/4;
[linestyle =solid; width=2] [name =haDelta; color=Green] haDelta:= haClose-haOpen; haDelta; [linestyle =solid; width=2] [name =SMAhaDelta; color=Red] Sdelta:= ma(haDelta,3,s); sdelta; [horzline =0] |
|
|
BC User since June 2007
|
|
|
|
|
jazza
Regular
Joined: 10 Aug 2007 Posts: 33 |
Post Options
Quote Reply
Posted: 11 Sep 2012 at 1:23am |
|
Dan Valcu uses this setup on his website. It has his "ha Delta>SMA(haDelta,3)"
This is to overcome the lagging aspects of the Heikin-Ashi. His formula description from the website: " The difference between ha Close and ha Open. Combined with a 3 day simple moving av. SMA(3). Visually it looks like a momentum oscillator as per below. Well beyond my script writing skills. Can I call on some more help again please. Mucho appreciated in advance. 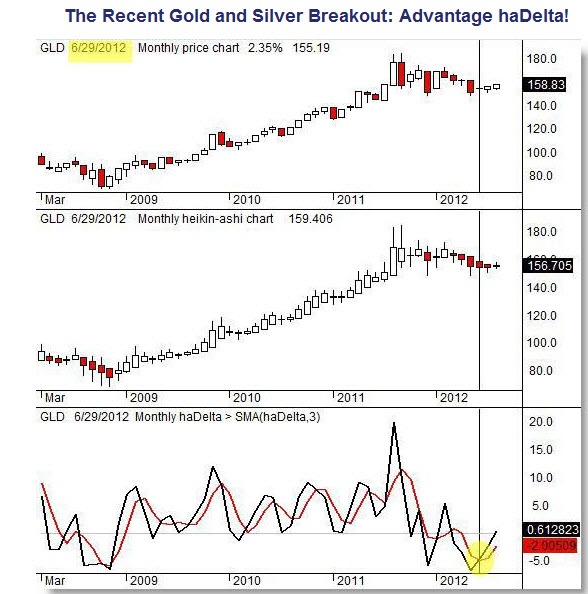 |
|
|
|
|
cmacdon
BullCharts Guru
Joined: 09 Sep 2012 Location: Brisbane Posts: 236 |
Post Options
Quote Reply
Posted: 10 Sep 2012 at 6:53pm |
|
Tried coding HA delta when Valcus book came out but, in my opinion, it is more erratic than the Ha oscillator provided above.
|
|
|
BC User since June 2007
|
|
|
|
|
Gordon7
Newbie
Joined: 09 Sep 2012 Location: Sydney Posts: 6 |
Post Options
Quote Reply
Posted: 10 Sep 2012 at 3:35pm |
No, that was cmacdon who shared his formulas. Credit where credit is due  Gordon |
|
|
|
|
jazza
Regular
Joined: 10 Aug 2007 Posts: 33 |
Post Options
Quote Reply
Posted: 10 Sep 2012 at 2:47pm |
|
Maximo, that’s certainly an improvement visually. As always,
thanks very much for your tireless input. Mucho appreciated. Cheers. Still curious as to why the down candles can’t be solid
filled? Hopefully one of the Bullcharts programmers might have a solution. Gordon, thanks very much for sharing your HA formulas and
template. Looks very interesting Will study and analyze . Great coding. Cheers. |
|
|
|
|
Post Reply
|
Page <1 2345> |
| Forum Jump | Forum Permissions You cannot post new topics in this forum You cannot reply to topics in this forum You cannot delete your posts in this forum You cannot edit your posts in this forum You cannot create polls in this forum You cannot vote in polls in this forum |


