Joe Ross consolidation |
Post Reply 
|
Page <123 |
| Author |
 Printable Version Printable Version Delicious Delicious Digg Digg Facebook Facebook Furl Furl Google Boomarks Google Boomarks Google Buzz Google Buzz MySpace MySpace Newsvine Newsvine reddit reddit StumbleUpon Translate StumbleUpon Translate Twitter Twitter Windows Live Windows Live Yahoo Bookmarks Yahoo Bookmarks Topic Search Topic Search  Topic Options Topic Options
|
charlie_8 
Regular 
Joined: 06 Apr 2011 Posts: 21 |
 Post Options Post Options
 Quote Reply Quote Reply
 Posted: 19 Sep 2011 at 10:53am Posted: 19 Sep 2011 at 10:53am |
|
Dear BS Forum Members,
In my Trading I often come back to ideas, that I found in books of Joe Ross. I'm pretty sure, that most of you know, who Joe Ross is (if not, then it is the best time to use googe :D). When I analyse particular stock, I use Ross Trading Software as well as I use Bullcharts. 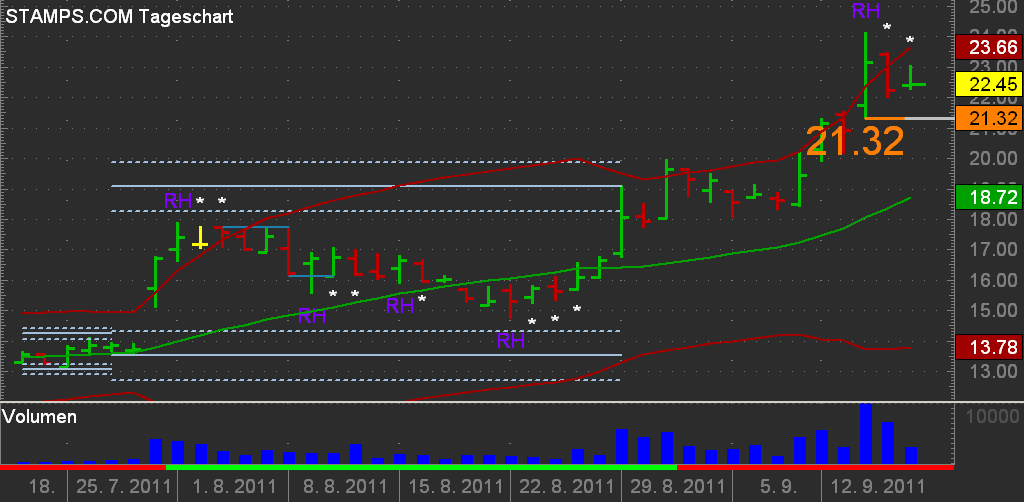 K There are many great setup ideas, that one can find by Mr.Ross and I'm glad to share some of them with you.One of them is consolidation and breakout of consolidation. My description will be very simlifyed, but I'm sure, you will get the point. According to Mr.Ross, consolidation starts (normally) with a bar (called measuring bar (MB)), when this bar is following by at least 4 bars, which opens and closes are within the price range of MB. When we get this situation, we can draw 2 horizontal lines, starting on high and low of the MB. This would be the trading range (TR). The TR exists until we get a bar, that opens and closes outside of trading range. So it is our setup. If this bar broke down of the TR, we will sell on stop placed some ticks under the low of the bar, if there was an breakup, we buy on stop above high of the breakup bar. 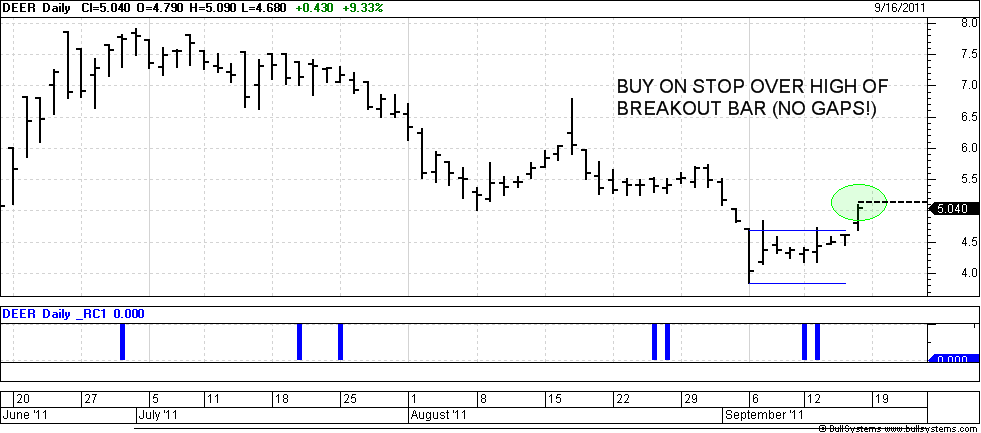 In my "barbarian" Bullscript it sonds like: HIST(H,4)>O AND HIST(L,4)<O AND HIST(H,4)>C AND HIST(L,4)<C AND HIST(H,4)>HIST(O,1) AND HIST(L,4)<HIST(O,1) AND HIST(H,4)>HIST(C,1) AND HIST(L,4)<HIST(C,1) AND HIST(H,4)>HIST(O,2) AND HIST(L,4)<HIST(O,2) AND HIST(H,4)>HIST(C,2) AND HIST(L,4)<HIST(C,2) AND HIST(H,4)>HIST(O,3) AND HIST(L,4)<HIST(O,3) AND HIST(H,4)>HIST(C,3) AND HIST(L,4)<HIST(C,3)  Maby somebody could help me to make such one indicator correctly? I mean on the price pane, with 2 horizontal lines, that end after breakout bar. And maby with price leves like by Darvas boxes? Sure this concept could be refine, for exampe, you will see very often doji bars as breakout bars - maby it would be clever not trade them? Or you could switch to higher timeframe to decide if particular parket is in trend or in consolidation and place the order based on your view of situation. Or when next day will open with gap, not try to catch the market? Mr.Ross never make a trade, if he sees a gap! It would be very nice to hear feedback about this setup! And any help by creating such indicator will be very appreciated. I wish all of you good trading! Edited by charlie_8 - 20 Sep 2011 at 6:53am |
|
 |
|
|
Post Reply
|
Page <123 |
| Forum Jump | Forum Permissions You cannot post new topics in this forum You cannot reply to topics in this forum You cannot delete your posts in this forum You cannot edit your posts in this forum You cannot create polls in this forum You cannot vote in polls in this forum |


