Joe Ross consolidation
Printed From: BullCharts Forum
Category: BullCharts
Forum Name: BullScript
Forum Discription: Technical discussion related specifically to the BullScript programming language.
URL: http://www.bullcharts.com.au/forum/forum_posts.asp?TID=741
Printed Date: 19 May 2024 at 7:56am
Software Version: Web Wiz Forums 9.69 - http://www.webwizforums.com
Topic: Joe Ross consolidation
Posted By: charlie_8
Subject: Joe Ross consolidation
Date Posted: 19 Sep 2011 at 10:53am
|
Dear BS Forum Members, In my Trading I often come back to ideas, that I found in books of Joe Ross. I'm pretty sure, that most of you know, who Joe Ross is (if not, then it is the best time to use googe :D). When I analyse particular stock, I use Ross Trading Software as well as I use Bullcharts. 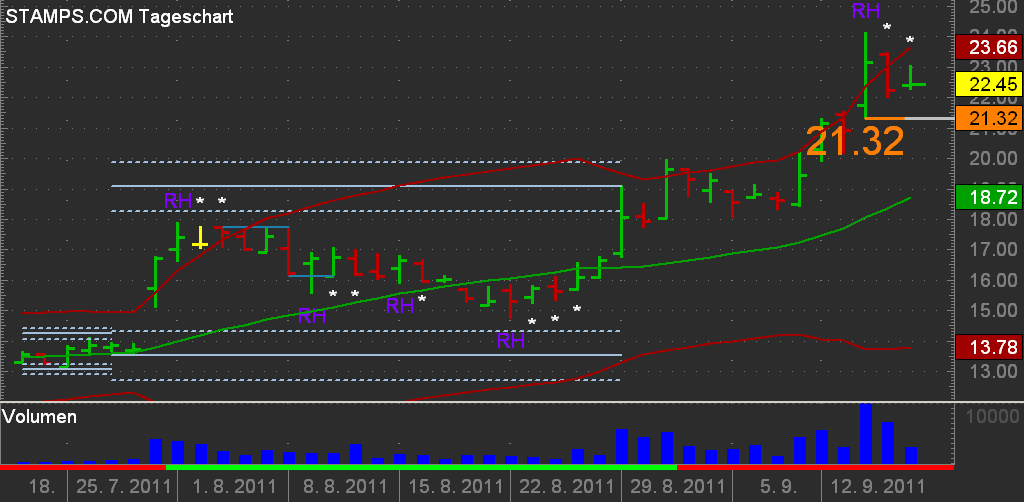 K There are many great setup ideas, that one can find by Mr.Ross and I'm glad to share some of them with you.One of them is consolidation and breakout of consolidation. My description will be very simlifyed, but I'm sure, you will get the point. According to Mr.Ross, consolidation starts (normally) with a bar (called measuring bar (MB)), when this bar is following by at least 4 bars, which opens and closes are within the price range of MB. When we get this situation, we can draw 2 horizontal lines, starting on high and low of the MB. This would be the trading range (TR). The TR exists until we get a bar, that opens and closes outside of trading range. So it is our setup. If this bar broke down of the TR, we will sell on stop placed some ticks under the low of the bar, if there was an breakup, we buy on stop above high of the breakup bar. 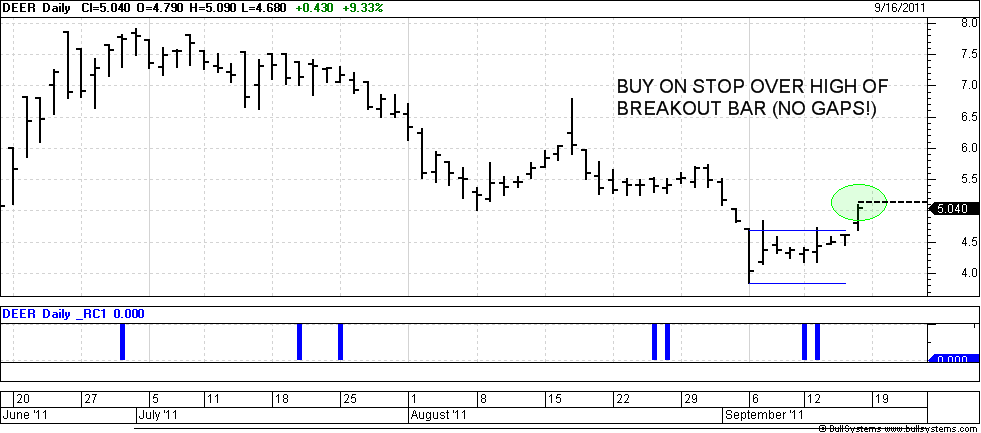 In my "barbarian" Bullscript it sonds like: HIST(H,4)>O AND HIST(L,4)<O AND HIST(H,4)>C AND HIST(L,4)<C AND HIST(H,4)>HIST(O,1) AND HIST(L,4)<HIST(O,1) AND HIST(H,4)>HIST(C,1) AND HIST(L,4)<HIST(C,1) AND HIST(H,4)>HIST(O,2) AND HIST(L,4)<HIST(O,2) AND HIST(H,4)>HIST(C,2) AND HIST(L,4)<HIST(C,2) AND HIST(H,4)>HIST(O,3) AND HIST(L,4)<HIST(O,3) AND HIST(H,4)>HIST(C,3) AND HIST(L,4)<HIST(C,3)  Maby somebody could help me to make such one indicator correctly? I mean on the price pane, with 2 horizontal lines, that end after breakout bar. And maby with price leves like by Darvas boxes? Sure this concept could be refine, for exampe, you will see very often doji bars as breakout bars - maby it would be clever not trade them? Or you could switch to higher timeframe to decide if particular parket is in trend or in consolidation and place the order based on your view of situation. Or when next day will open with gap, not try to catch the market? Mr.Ross never make a trade, if he sees a gap! It would be very nice to hear feedback about this setup! And any help by creating such indicator will be very appreciated. I wish all of you good trading! |
Replies:
Posted By: cmacdon
Date Posted: 16 Dec 2012 at 3:18pm
|
charlie-B As discussed in private email I will post somewting under the stepped price post to provide perhaps a better outcome Charles ------------- BC User since June 2007 |
Posted By: charlie_8
Date Posted: 17 Dec 2012 at 3:12am
|
Thank you for the answer Charles! I think, I'll try explain this concept of consolidation and how I use it in my trading in more detail. My writing skills in English are far away from perfect, so I`m sorry for that and will try my best hoping that my post will be easy to read. In my trading I tried to find the way, where I not have to use any technical indicators or predict any swings / reversal. I dont use VSA and dont pay any attention to volume, although I have read Wycoff's Trading Course, "Mastering the Markets" and both Volumes of Gavin Holmes. I found it very useful for expressive explanation of the past (like Gavin does it on YouTube), but not for making any decisions for the future price action. In most cases, using classical methods of support / resistance levels and HH / LL one would achieve same results (if not better), than using VSA without facing what I called for me the TMI problem (Too Much Information). It means, that if we incorporate in our decision making more and more logical steps (entities) with more then one possible outcomes, we have to summarize and weight all the possible outcomes, what in turn makes desicion makig much complcated. But equity markets are simplier: they go up or down or sideways. (About misleading volume data one may find this article interesting: http://articles.businessinsider.com/2011-01-04/markets/30003404_1_stock-market-technical-analysis-trading-system - http://articles.businessinsider.com/2011-01-04/markets/30003404_1_stock-market-technical-analysis-trading-system ). I also bought this book of Grimes because I found there some price action ideas close corresponding to mine. So I'm seekeng simlicity, but one, that based on the market reality. For me the only market reality that we have is the market price. A particular market goes higher, because price breaks high(s) of previous bar(s) and from time to time in strong uptrends bars will close higher, than high(s) of previous bar(s). A particular market goes lower, because price breaks low(s) of previous bar(s) and from time to time in strong downtrends bars will close lower, than low(s) of previous bar(s). (It seems to be obvious, but many traders tend to use moving averages instead of that simple observation). And theres is time, when a market gose nowhere, and the it is worth to take a closer look to this market. Quite simple, isn't is? But what does it mean, that the market goes nowhere? If you goolgle "consolidation" or "trading range" you would find pictures with price bars (or candlesticks), that fluctuate building swings and pivot points mostly between two horizontal boundaries. But I trying to exclude swings from my trading because they are highly unpredictably. So I searched for the way, where I could to determine the volatility contraction without paying attention on swings, misleading boundaries and otherways without using indicators like Bollinger Bands or any mean reversion volatility concepts. And one day I read in one of Ross's book about how he determine the consolidation. It is not his core conceps like 1-2-3 Formations or hooks, therefore it took some time before I started to watch this idea somtig deeper. Take a look on the monthly chart of LNC (the same stock that you Charles used for introducing stepped indicator): 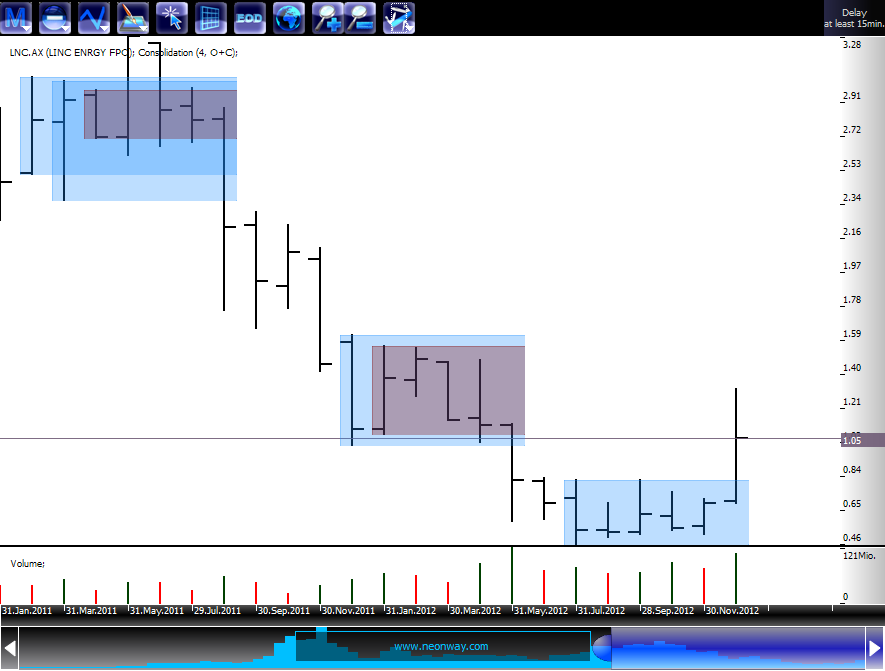 We see, that after volatility exansion (trend), we see at least 4 bars, that open or closes, or open and close within the range of the bar (no hard boundaries), that called "measuring bar" and it is the end bar of volatility expansion. Let's us take a look on the whole history of LNC (that I have). 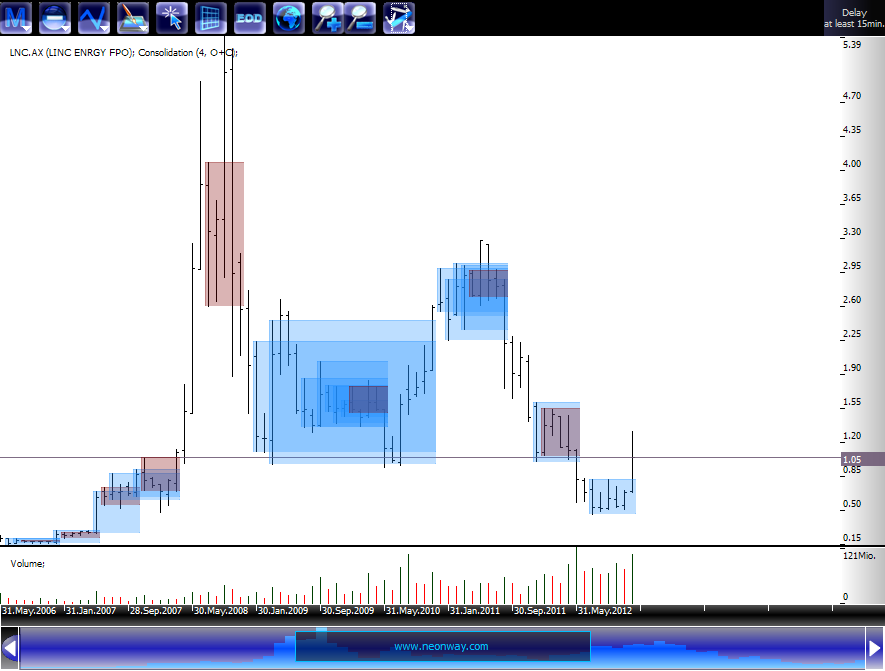 So what is the simliest way to trade volatility expansion? Let's zoom the year 2007. 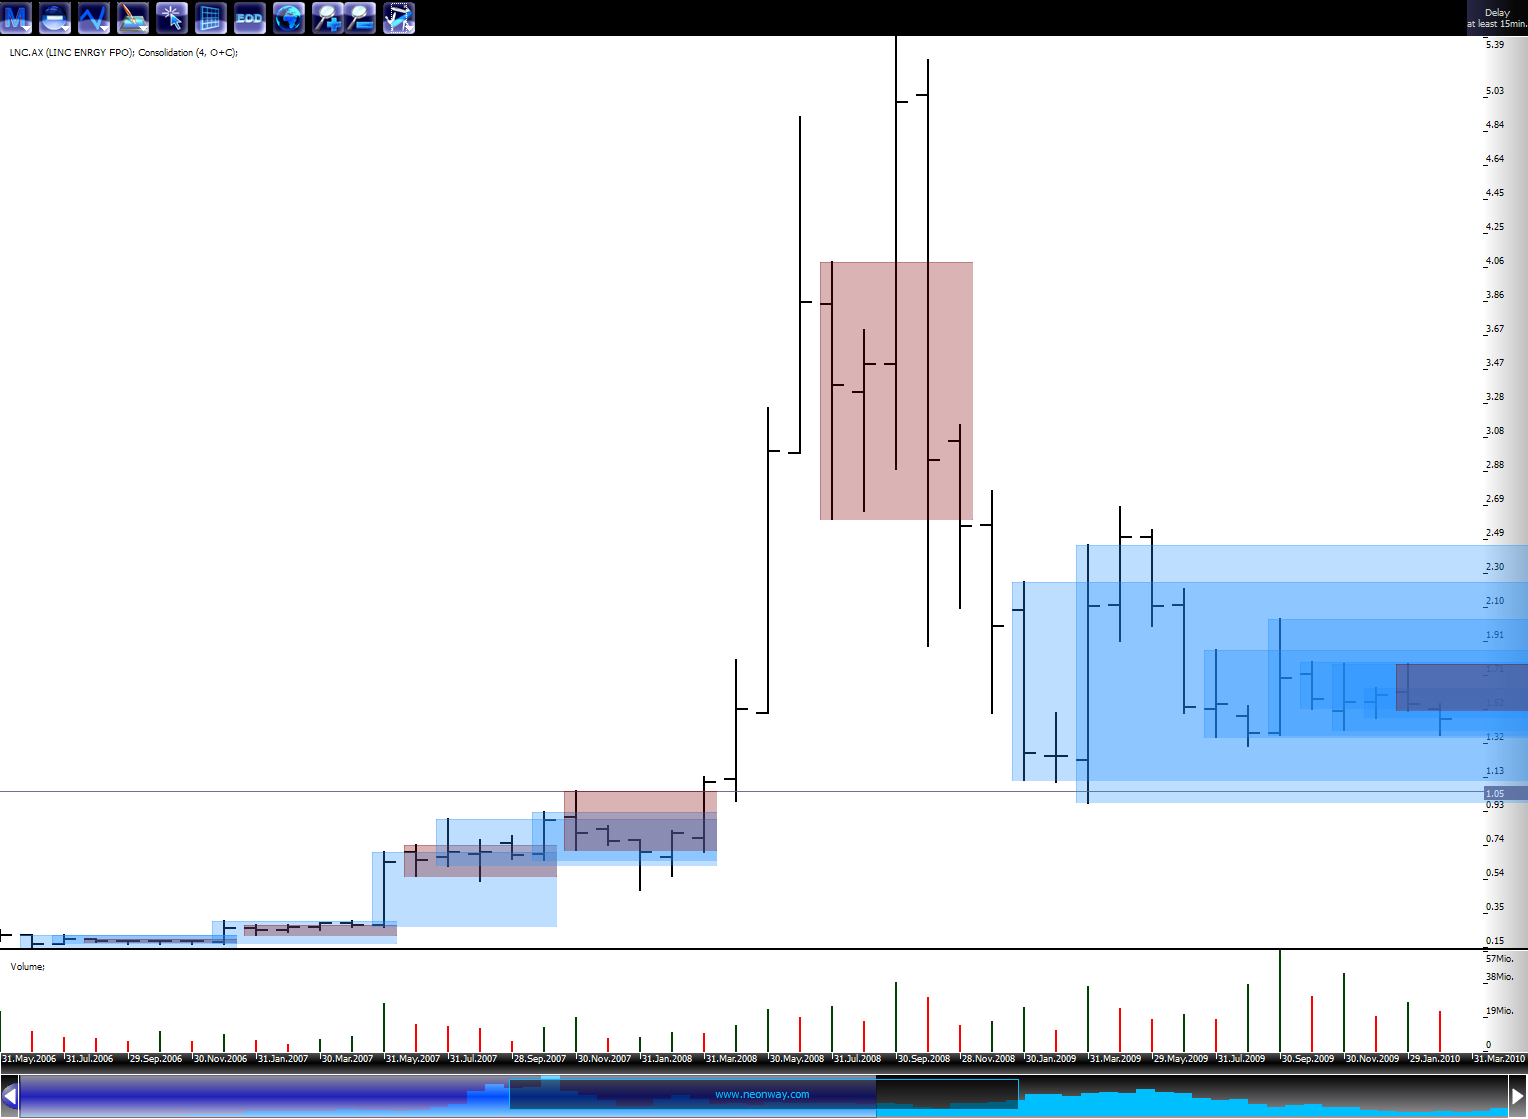 I'm using mutiple timeframes for analysis and trading. So if I see an consolidation on Monthly graph, I would search for entries on Weekly (may be also Daily) timeframe. There are many possibilities to step into position, but the simpliest one would be to go with the market after first correction after breakout. 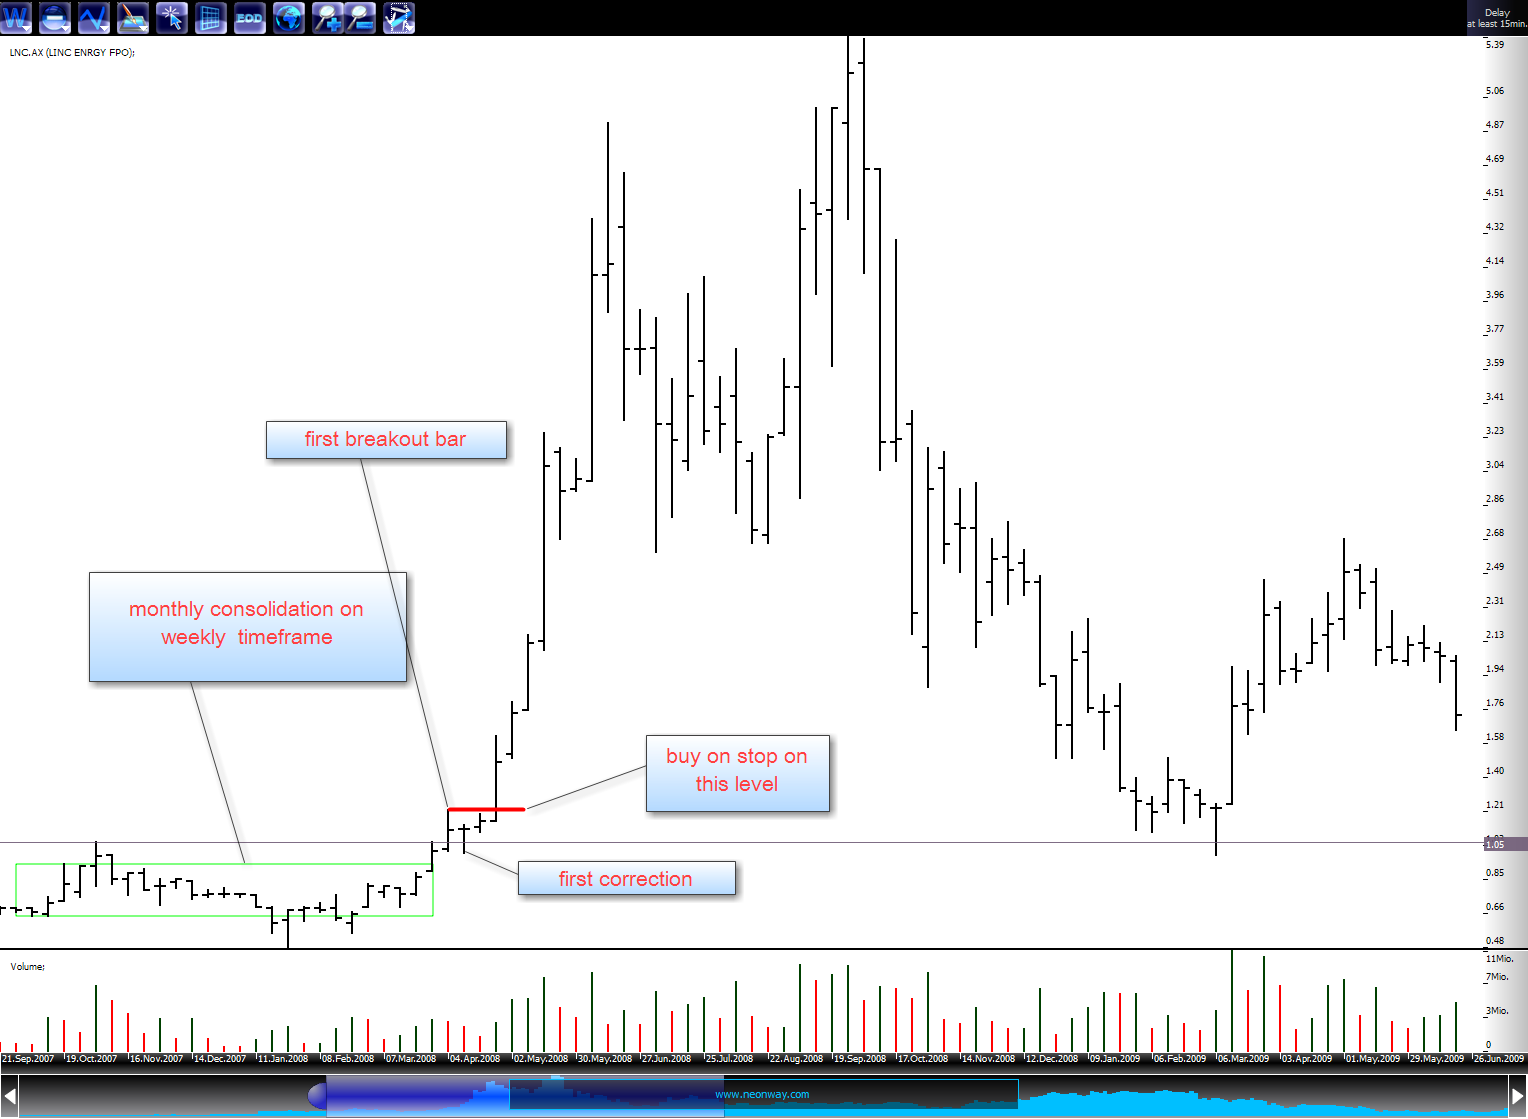 As iI said, this is the simpliest way to step into position. So I only described here the core idea of trading of such kind of volatility expansion. If someone would find it interesting or useful, feel free to post suggestion / question to me.  |
Posted By: cmacdon
Date Posted: 17 Dec 2012 at 4:22pm
|
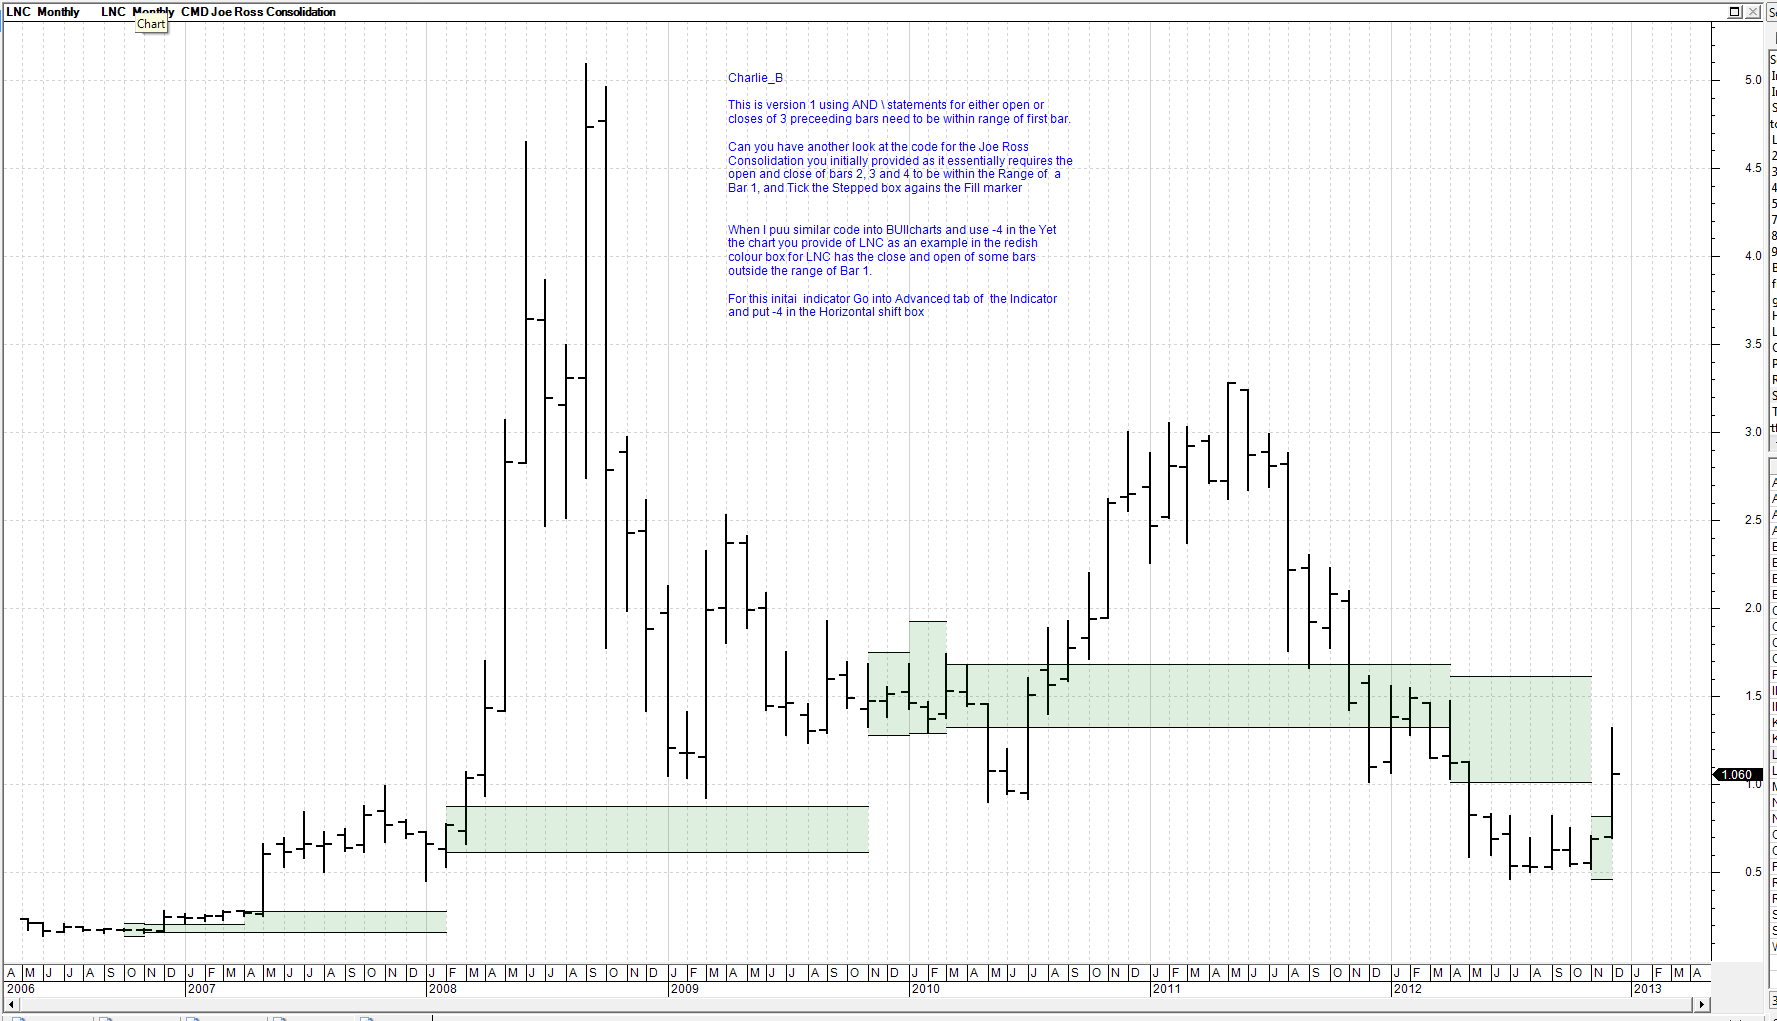
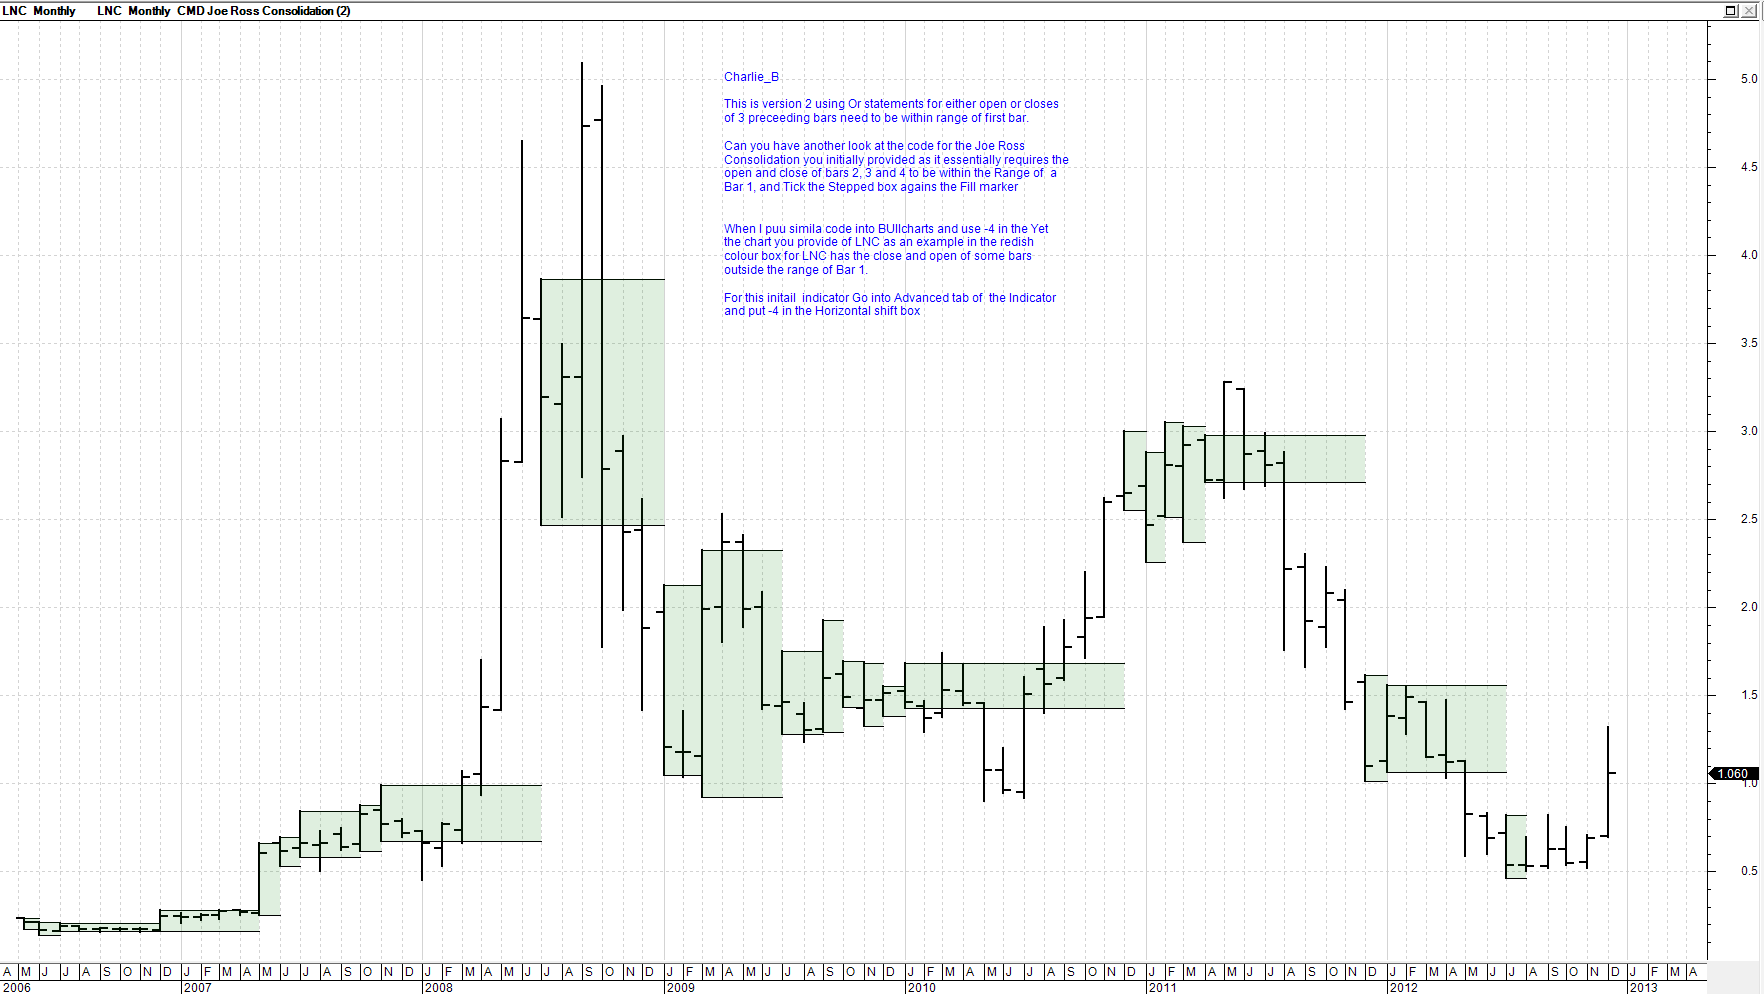
Charlie-B As previousyl advised I no nothing about Joe Ross but reading what you are trying to do I did a version 1 whichemulates the original code you provided using all AND statements similar to you code but that chart does not emulate the one you sent through for LNC so I think your original code may not be correct. Your original code is suggesting both the open and the close of bars 2, bar 3 and bar 4 should be within the range of bar 1 yet if you look at the reddish box on the monthly chart of LNC you provided some bars have opens and closes outside of the range 1 bar. Consequently I changed that version code to use OR statements i.e. either the open or the close of bars 2 and bar 3 and bar4 should be within the range of bar 1, and this appears better so I providede that code below. If you correctly the code let us know. When putting on the indicator, go into the advanced Tab abd put -4 in the Horizontal shift box and it locks the fill to the relevant bar 1. In the Style box for the fill tick the stepped option With the way the Horz step works it does not truncate after 4 bars but I am not sure that is a big hindrance when looking at the chart and helps show the breakouts I will post two charts the origtinal using AND in Code and the second version using OR as set out below Charles [Description ="Joe Ross Consolidation Draft 1"] [target =price;] a:= If(((O<Hist(H,4) and O> Hist(L,4)) OR (C<Hist(H,4) and C> Hist(L,4))) AND ((Hist(O,1)<Hist(H,4) and Hist(O,1)> Hist(L,4)) OR (Hist(C,1)<Hist(H,4) and Hist(C,1)> Hist(L,4))) AND ((Hist(O,2)<Hist(H,4) and Hist(O,2)> Hist(L,4)) OR (Hist(C,2)<Hist(H,4) and Hist(C,2)> Hist(L,4))) AND ((Hist(O,3)<Hist(H,4) and Hist(O,3)> Hist(L,4)) OR (Hist(C,3)<Hist(H,4) and Hist(C,3)> Hist(L,4))),1,0);
{ Top Line} [name =Top line; linestyle=Horz Step; color=Black; width=1] JRH:= If((a=1),Hist(H,4) ,Undefined); JRH; { Bottom Line } [name =Bottom Line; linestyle=Horz Step; color=Black; width=1] JRL:= If((a=1),Hist(L,4),Undefined); JRL; { Infill colour on Trends } [name =VFill colour; linestyle=fill] [color =Green] Valuewhen(1,JRH,Hist(H,4)); [color =Green] Valuewhen(1,JRL,Hist(L,4)); ------------- BC User since June 2007 |
Posted By: cmacdon
Date Posted: 17 Dec 2012 at 4:23pm
 ------------- BC User since June 2007 |
Posted By: cmacdon
Date Posted: 17 Dec 2012 at 4:24pm
 ------------- BC User since June 2007 |
Posted By: charlie_8
Date Posted: 17 Dec 2012 at 6:58pm
| umfortinatly the code in my first post wasn't coorect, I saw it some time after I allready posted it. But becaise nobody has answered, I forgot about this. I'm sorry for that. I will try to explain the construction of such consolidadion soon in my new post. |
Posted By: charlie_8
Date Posted: 21 Dec 2012 at 3:03pm
Before we can start to dicuss consolidation (or volatility contraction area), let me show you the paintjob, that I made in MS Word. It shows us some posibilitis of price behavior within the area if consolidation: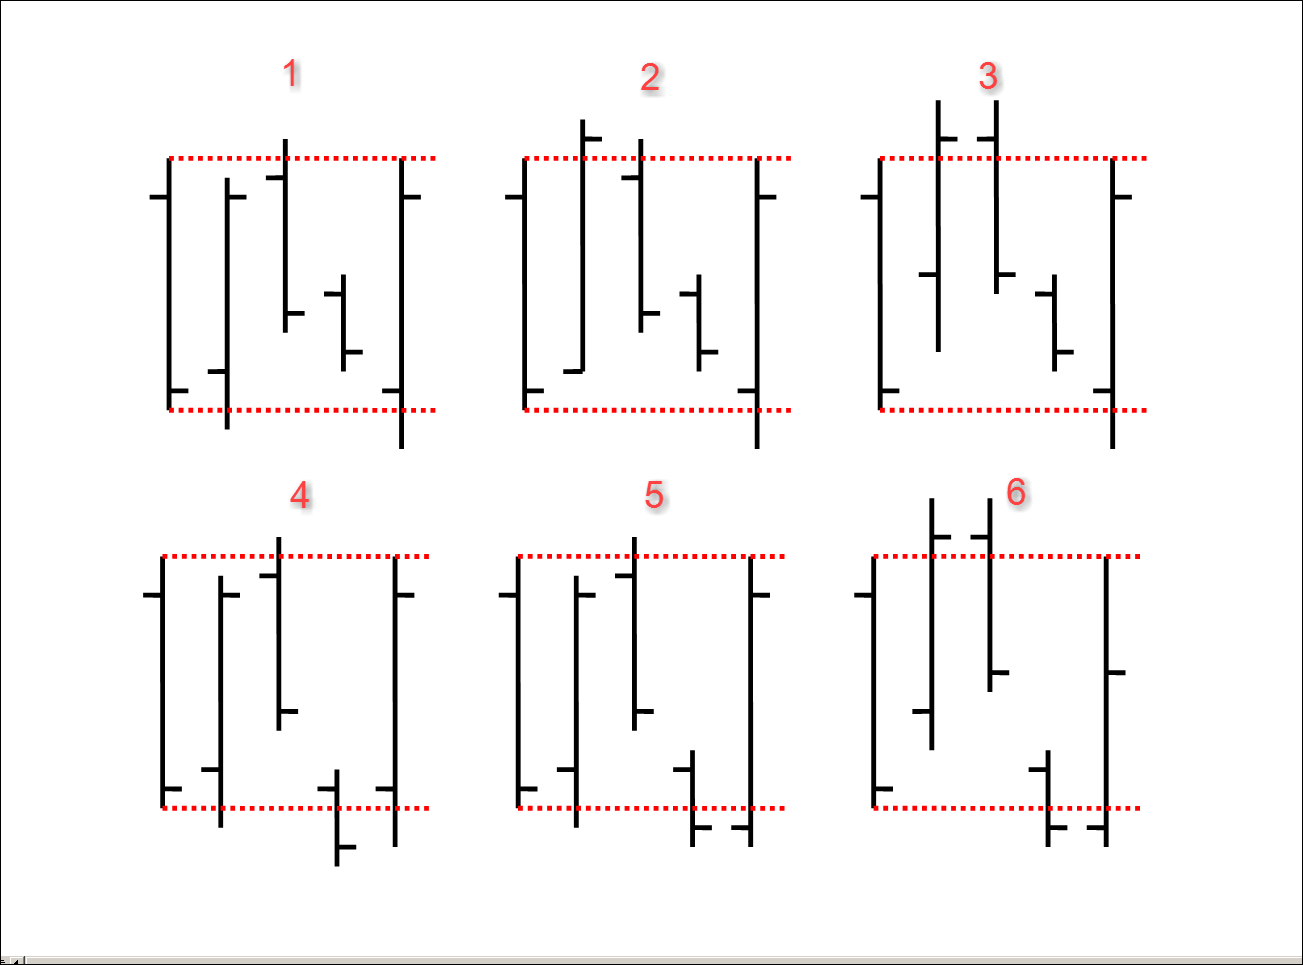 I painted 6 cases in total with the goal to show you some possibilities of price distribution in consolidation. There are only painted examples for you to make the idea clear. Every first bar in each exampe of consolidation is called "measuring bar". In some cases it is a long bar, that often comes on the end of market movement. This bar measures the trading range (dotted red lines). For completing of a consolidation we need to see such measuring bar and at least (its a minimum number) 4 following bar with O and C of each bar inside of the range of measuring bar (H and L breakouts don't matter) - like in the CASE 1, or only O or C of any of those 4 bars within the range of the measuring bar (like in CASES 2 to 6). Again, H and L of any bar could penetrate the trading range of a measuring bar, and this particular bar could also close outside of trading range. Very next bar could also opens outside consolidation, but only if this bar closes outside trading range, we can say, that consolidation is broken. 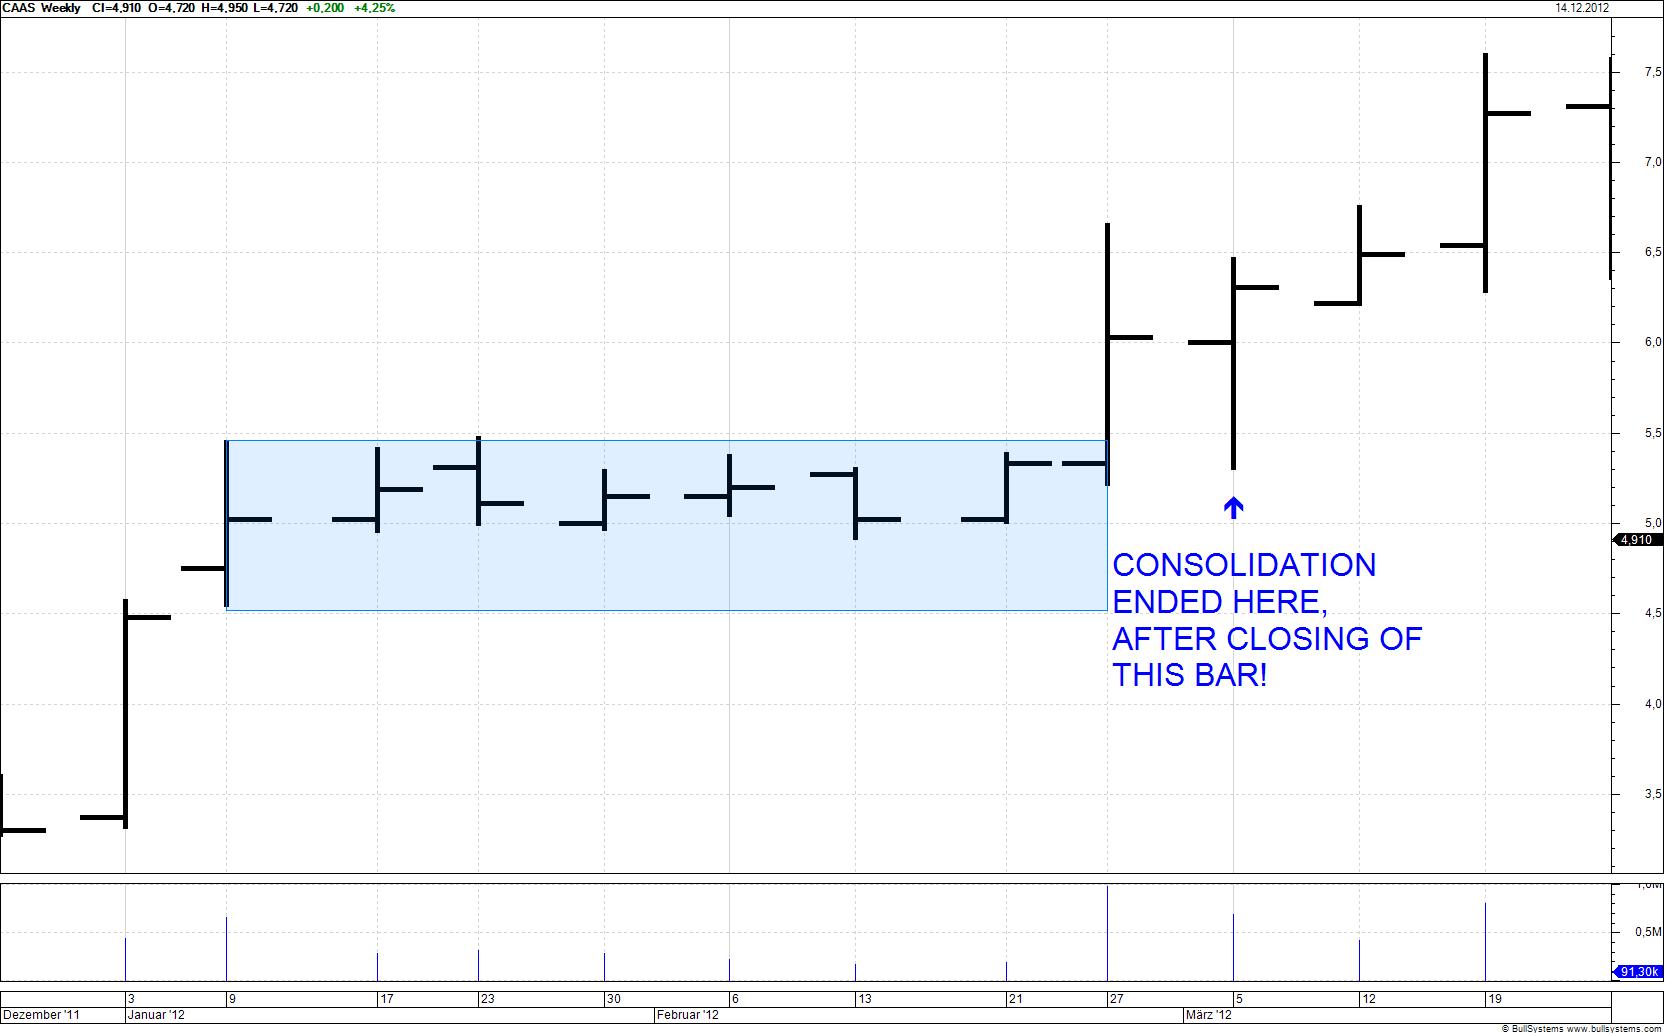 Inside of showed consolidation on CAAS are 2 other consolidations (I just didnt painted them)!  This was a theoretical part so far. I'll show some practical examles in my next post. |
Posted By: cmacdon
Date Posted: 21 Dec 2012 at 3:30pm
|
Charlie-B I downloaded some Joe Ross stfuff from internet and willl have a look at over the weekend. There seems to be a lot of writings. What particuloar references and pages of his work are you using? Charles ------------- BC User since June 2007 |
Posted By: charlie_8
Date Posted: 22 Dec 2012 at 5:32am
| Charles, could you please tell me what did you habe already downloaded? I read almost everything from him, but mostly in German. |
Posted By: cmacdon
Date Posted: 22 Dec 2012 at 9:21am
|
1. Trading the Ross Hook 2.The Law of Charts 3. Presentation on Traders Trick Entry ------------- BC User since June 2007 |
Posted By: charlie_8
Date Posted: 23 Dec 2012 at 5:48am
|
Charles, my indicator based on Chapter 5 "Identifying Congestion" from "Trading the Ross Hook". I'm using both definition of congestion given by Ross in ths Chapter. But as I said I'm using it on multiplen timeframes. The last presentation is in German, isn't it? Happy reading! |
Posted By: cmacdon
Date Posted: 23 Dec 2012 at 11:09am
|
Charlie_b Here is congestion Rule from Appendix of Joe Ross Book RULE: ANY TIME PRICES OPEN
OR CLOSE ON FOUR CONSECUTIVE BARS, WITHIN THE CONFINES
OF THE RANGE OF A “MEASURING BAR,” YOU HAVE CONGESTION. THIS IS REGARDLESS OF
WHERE THE HIGHS AND LOWS MAY BE LOCATED. A “MEASURING BAR” BECOMES SUCH BY
VIRTUE OF ITS PRICE RANGE CONTAINING THE
OPENS OR CLOSES OF AT LEAST 3 OF 4 SUBSEQUENT PRICE BARS. It is essentially the same as code previously posted above and seems to replkicate the boxes on LNC charts you posted above. I have tidied up the code by inserting Hoz Step and Fill step atrtibutes and a clearer color for the fill. So now you only have to go into the Advanced Tab and insert -4 in the Horizontal shift box when you apply the indicator and it will work as intended. The horz step in Bulllcharts does not truncate after 4 bars and extends until such time as a new box isformed by the indicator trigger and that is why you sometimes get staggered boxes on the chart. The extension of the Horz step may not be a bad thing as it clearly shows breakouts and Joe Ross seems to have three categories of Congestion Sideways price movement may be broken
into three distinct and definable areas: 1. Ledges ¾ consisting of no more
than 10 price bars 2. Congestions ¾ 11-20 price bars
inclusive 3. Trading Ranges ¾ 21 bars or more with
a breakout usually occurring on price bars 21-29 inclusive. [Description ="Joe Ross Consolidation"]
[target =price;]
a:= If(((O<Hist(H,4) and O> Hist(L,4)) OR (C<Hist(H,4) and C> Hist(L,4)))
AND ((Hist(O,1)<Hist(H,4) and Hist(O,1)> Hist(L,4)) OR (Hist(C,1)<Hist(H,4) and Hist(C,1)> Hist(L,4)))
AND ((Hist(O,2)<Hist(H,4) and Hist(O,2)> Hist(L,4)) OR (Hist(C,2)<Hist(H,4) and Hist(C,2)> Hist(L,4)))
AND ((Hist(O,3)<Hist(H,4) and Hist(O,3)> Hist(L,4)) OR (Hist(C,3)<Hist(H,4) and Hist(C,3)> Hist(L,4))),1,0);
{ Top Line}
[name =Top line; linestyle=Horz Step; color=Black; width=1]
JRH:= If((a=1),Hist(H,4) ,Undefined);
JRH;
{ Bottom Line }
[name =Bottom Line; linestyle=Horz Step; color=Black; width=1]
JRL:= If((a=1),Hist(L,4),Undefined);
JRL;
{ Infill colour on Trends }
[name =Fill colour; linestyle=fill Step]
[color =Cyan] Valuewhen(1,JRH,Hist(H,4));
[color =Cyan] Valuewhen(1,JRL,Hist(L,4)); ------------- BC User since June 2007 |
Posted By: cmacdon
Date Posted: 25 Dec 2012 at 9:23am
|
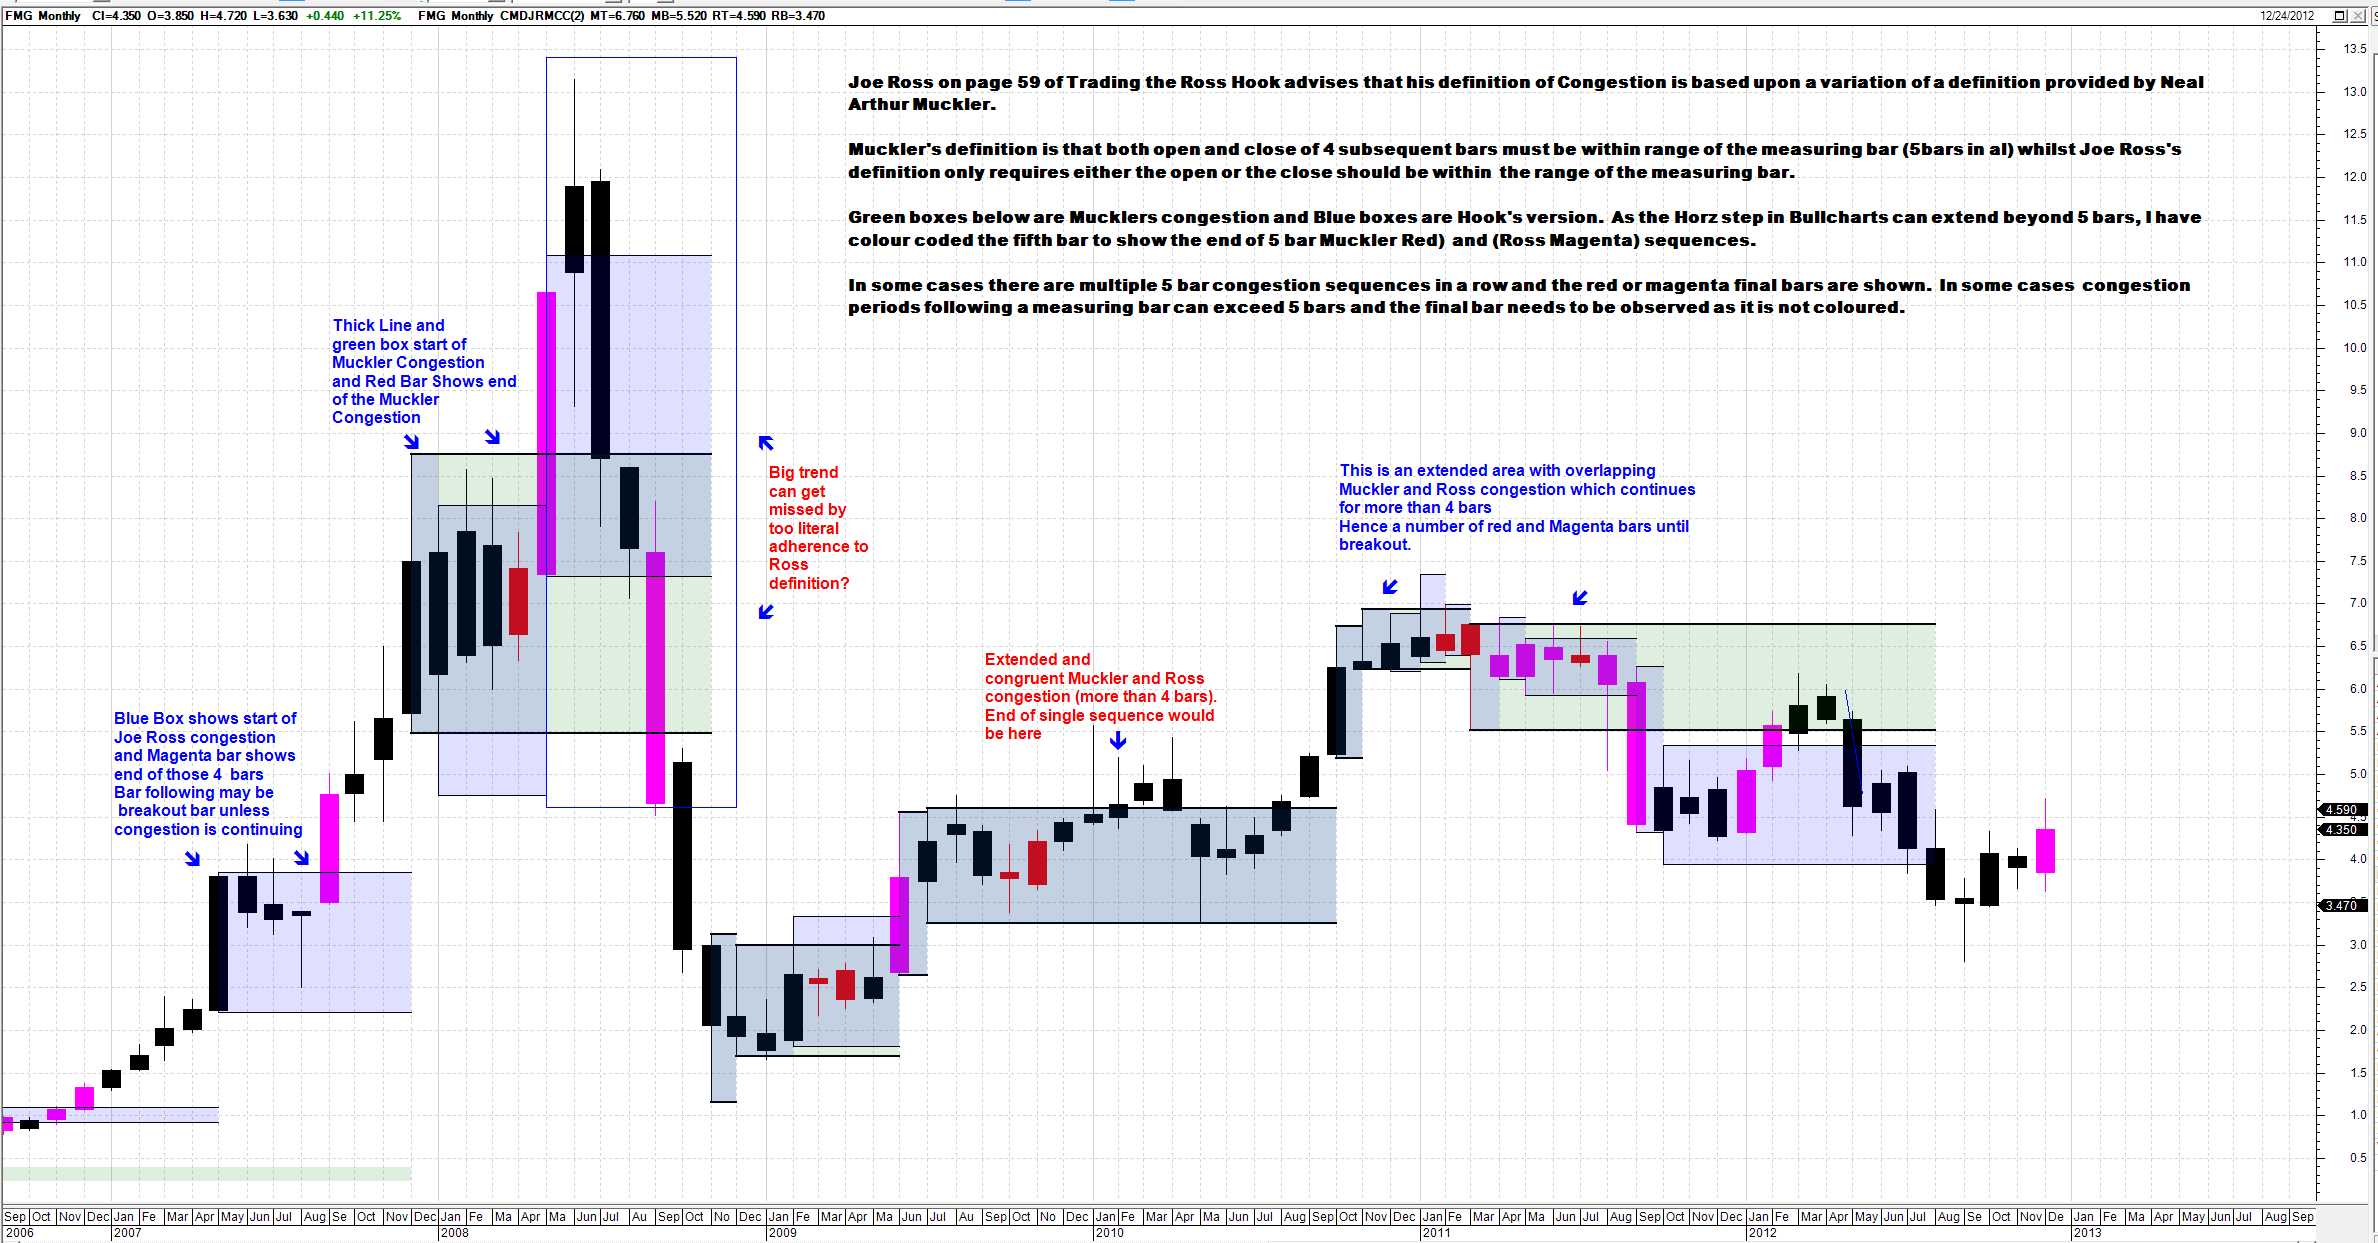
Charlie_B Rereading chapter 5, your original code above seems to be the Neal Arthur Muckler congestion definition which Joe Ross states he then varied for his definition of congestion p59. So here is amalgam code of both definitions. You can swith either on or off in the styles tab. Still insert Horizontal shift -4 in the advance tab to align the indicator properly. I also coloured red or Magenta the final bar in the definition sequences to try and overcome the Horxstep being extended beyond 5 bar. I used teh fill candle option in candlesticks In many cases the bar following a coloured bar is the breakout bar but not all cases see notes on the chart. Merry Christmas Self explanatory chart and code posted below showing both Muckler and Ross Congestion[Description ="Joe Ross Identifying Congestion Chapter 5 Trading the Ross Hook"] [target =price;] { This was the original Congestion Formula provided to Joe Ross by Neal Arthur Muckler p.59} a:= If(((O<Hist(H,4) and O> Hist(L,4)) AND (C<Hist(H,4) and C> Hist(L,4))) AND ((Hist(O,1)<Hist(H,4) and Hist(O,1)> Hist(L,4)) AND (Hist(C,1)<Hist(H,4) and Hist(C,1)> Hist(L,4))) AND ((Hist(O,2)<Hist(H,4) and Hist(O,2)> Hist(L,4)) AND (Hist(C,2)<Hist(H,4) and Hist(C,2)> Hist(L,4))) AND ((Hist(O,3)<Hist(H,4) and Hist(O,3)> Hist(L,4)) AND (Hist(C,3)<Hist(H,4) and Hist(C,3)> Hist(L,4))),1,0);
{ This was the Joe Ross variation to the above formula p.59} a1:= If(((O<Hist(H,4) and O> Hist(L,4)) OR (C<Hist(H,4) and C> Hist(L,4))) AND ((Hist(O,1)<Hist(H,4) and Hist(O,1)> Hist(L,4)) OR (Hist(C,1)<Hist(H,4) and Hist(C,1)> Hist(L,4))) AND ((Hist(O,2)<Hist(H,4) and Hist(O,2)> Hist(L,4)) OR (Hist(C,2)<Hist(H,4) and Hist(C,2)> Hist(L,4))) AND ((Hist(O,3)<Hist(H,4) and Hist(O,3)> Hist(L,4)) OR (Hist(C,3)<Hist(H,4) and Hist(C,3)> Hist(L,4))),1,0);
{Muckler Top Line} [name =MTop line; linestyle=Horz Step; color=Black; width=2;] MH:= If((a=1),Hist(H,4),Undefined); MH;
{Muckler Bottom Line } [name =MBottom Line; linestyle=Horz Step; color=Black; width=2;] ML:= If((a=1),Hist(L,4),Undefined); ML;
{M Infill colour on Trends } [name =MucklerCongestion fill; linestyle=fill Step] [color =Green] Valuewhen(1,MH,Hist(H,4)); [color =Green] Valuewhen(1,ML,Hist(L,4));
{Joe Ross Variation Top Line} [name =RTop line; linestyle=Horz Step; color=Black; width=1;] JRH1:= If((a1=1),Hist(H,4) ,Undefined); JRH1; {Joe Ross Variation Bottom Line } [name =RBottom Line; linestyle=Horz Step; color=Black; width=1;] JRL1:= If((a1=1),Hist(L,4),Undefined); JRL1; {R Infill colour on Trends } [name =Ros Congestion Fill color; linestyle=fill Step] [color =Blue] Valuewhen(1,JRH1,Hist(H,4)); [color =Blue] Valuewhen(1,JRL1,Hist(L,4));
[Visible =True;] [target =Price; linestyle=PriceColor]
[name =Muckler Congestion Bars;Color=Red] If ( a,1,0); [name =Ross Congestion Bars;Color=Magenta] If ( a1, 1, 0);
------------- BC User since June 2007 |
Posted By: cmacdon
Date Posted: 25 Dec 2012 at 9:25am
 ------------- BC User since June 2007 |
Posted By: charlie_8
Date Posted: 26 Dec 2012 at 8:49am
|
Dear Charles! I'm extremly gratefull to you for your help! I wish you and other forum members merry xmas! As far I know for Muckler's consolidation only C of 4 subsequent bars are important (regardless where O are). But I think that your version with O and C is very interestimg, too! |
Posted By: cmacdon
Date Posted: 26 Dec 2012 at 10:39am
|
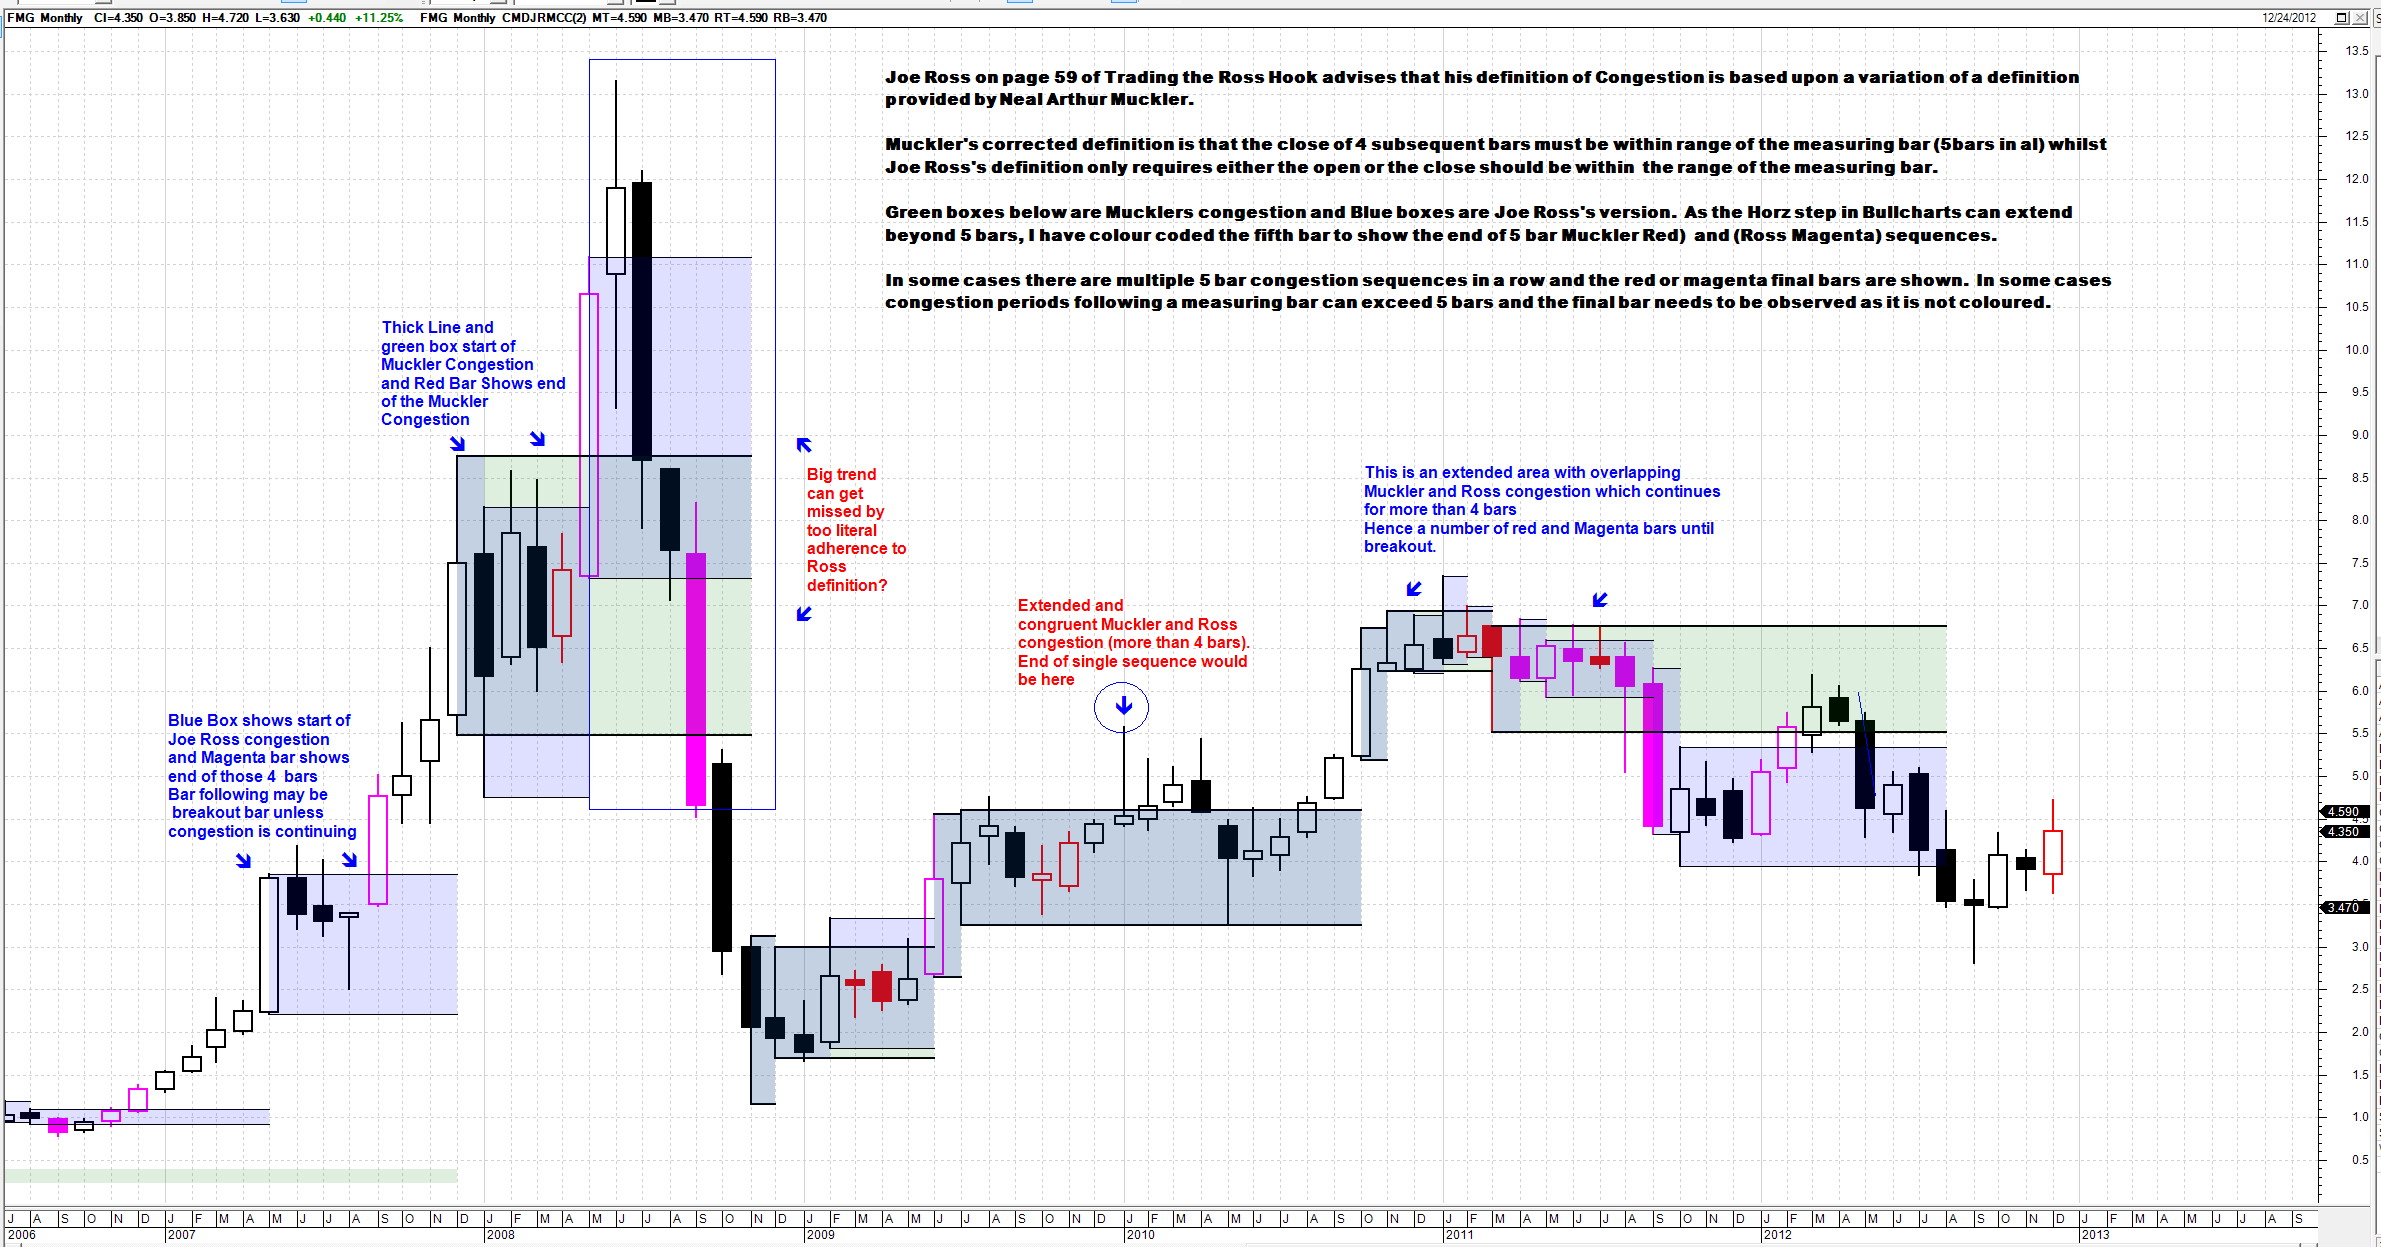
Charlie-B Your quite right Rereading again Mucklers version is all C within measuring bar ignoring open. Here is amended code and same FMG Chart monthly but without candle colour Fills. I think I have circled the only breakout change caused by excluding the opens in Muklers corrected code the breakout to an Jan 10 J from Feb 2012 is one bar earlier. [Description ="Joe Ross Identifying Congestion Chapter 5 Trading the Ross Hook"] [target =price;] { This was the original Congestion Formula provided to Joe Ross by Neal Arthur Muckler p.59} a:= If((C<Hist(H,4) and C> Hist(L,4)) AND (Hist(C,1)<Hist(H,4) and Hist(C,1)> Hist(L,4)) AND (Hist(C,2)<Hist(H,4) and Hist(C,2)> Hist(L,4)) AND (Hist(C,3)<Hist(H,4) and Hist(C,3)> Hist(L,4)),1,0);
{ This was the Joe Ross variation to the above formula p.59} a1:= If(((O<Hist(H,4) and O> Hist(L,4)) OR (C<Hist(H,4) and C> Hist(L,4))) AND ((Hist(O,1)<Hist(H,4) and Hist(O,1)> Hist(L,4)) OR (Hist(C,1)<Hist(H,4) and Hist(C,1)> Hist(L,4))) AND ((Hist(O,2)<Hist(H,4) and Hist(O,2)> Hist(L,4)) OR (Hist(C,2)<Hist(H,4) and Hist(C,2)> Hist(L,4))) AND ((Hist(O,3)<Hist(H,4) and Hist(O,3)> Hist(L,4)) OR (Hist(C,3)<Hist(H,4) and Hist(C,3)> Hist(L,4))),1,0);
{Muckler Top Line} [name =MTop line; linestyle=Horz Step; color=Black; width=2;] MH:= If((a=1),Hist(H,4),Undefined); MH;
{Muckler Bottom Line } [name =MBottom Line; linestyle=Horz Step; color=Black; width=2;] ML:= If((a=1),Hist(L,4),Undefined); ML;
{M Infill colour on Trends } [name =MucklerCongestion fill; linestyle=fill Step] [color =Green] Valuewhen(1,MH,Hist(H,4)); [color =Green] Valuewhen(1,ML,Hist(L,4));
{Joe Ross Variation Top Line} [name =RTop line; linestyle=Horz Step; color=Black; width=1;] JRH1:= If((a1=1),Hist(H,4) ,Undefined); JRH1; {Joe Ross Variation Bottom Line } [name =RBottom Line; linestyle=Horz Step; color=Black; width=1;] JRL1:= If((a1=1),Hist(L,4),Undefined); JRL1; {R Infill colour on Trends } [name =Ros Congestion Fill color; linestyle=fill Step] [color =Blue] Valuewhen(1,JRH1,Hist(H,4)); [color =Blue] Valuewhen(1,JRL1,Hist(L,4));
[Visible =True;] [target =Price; linestyle=PriceColor]
[name =Muckler Congestion Bars;Color=Red] If ( a,1,0); [name =Ross Congestion Bars;Color=Magenta] If ( a1, 1, 0);
------------- BC User since June 2007 |
Posted By: cmacdon
Date Posted: 26 Dec 2012 at 10:40am
 ------------- BC User since June 2007 |
Posted By: charlie_8
Date Posted: 26 Dec 2012 at 11:08am
|
Thank you again Charles! Again, regardless of that it was a mistake, you caugt a very interesting point! I think I'll take a closer look to you "false" Muckler's congestion. |
Posted By: cmacdon
Date Posted: 26 Dec 2012 at 10:22pm
|
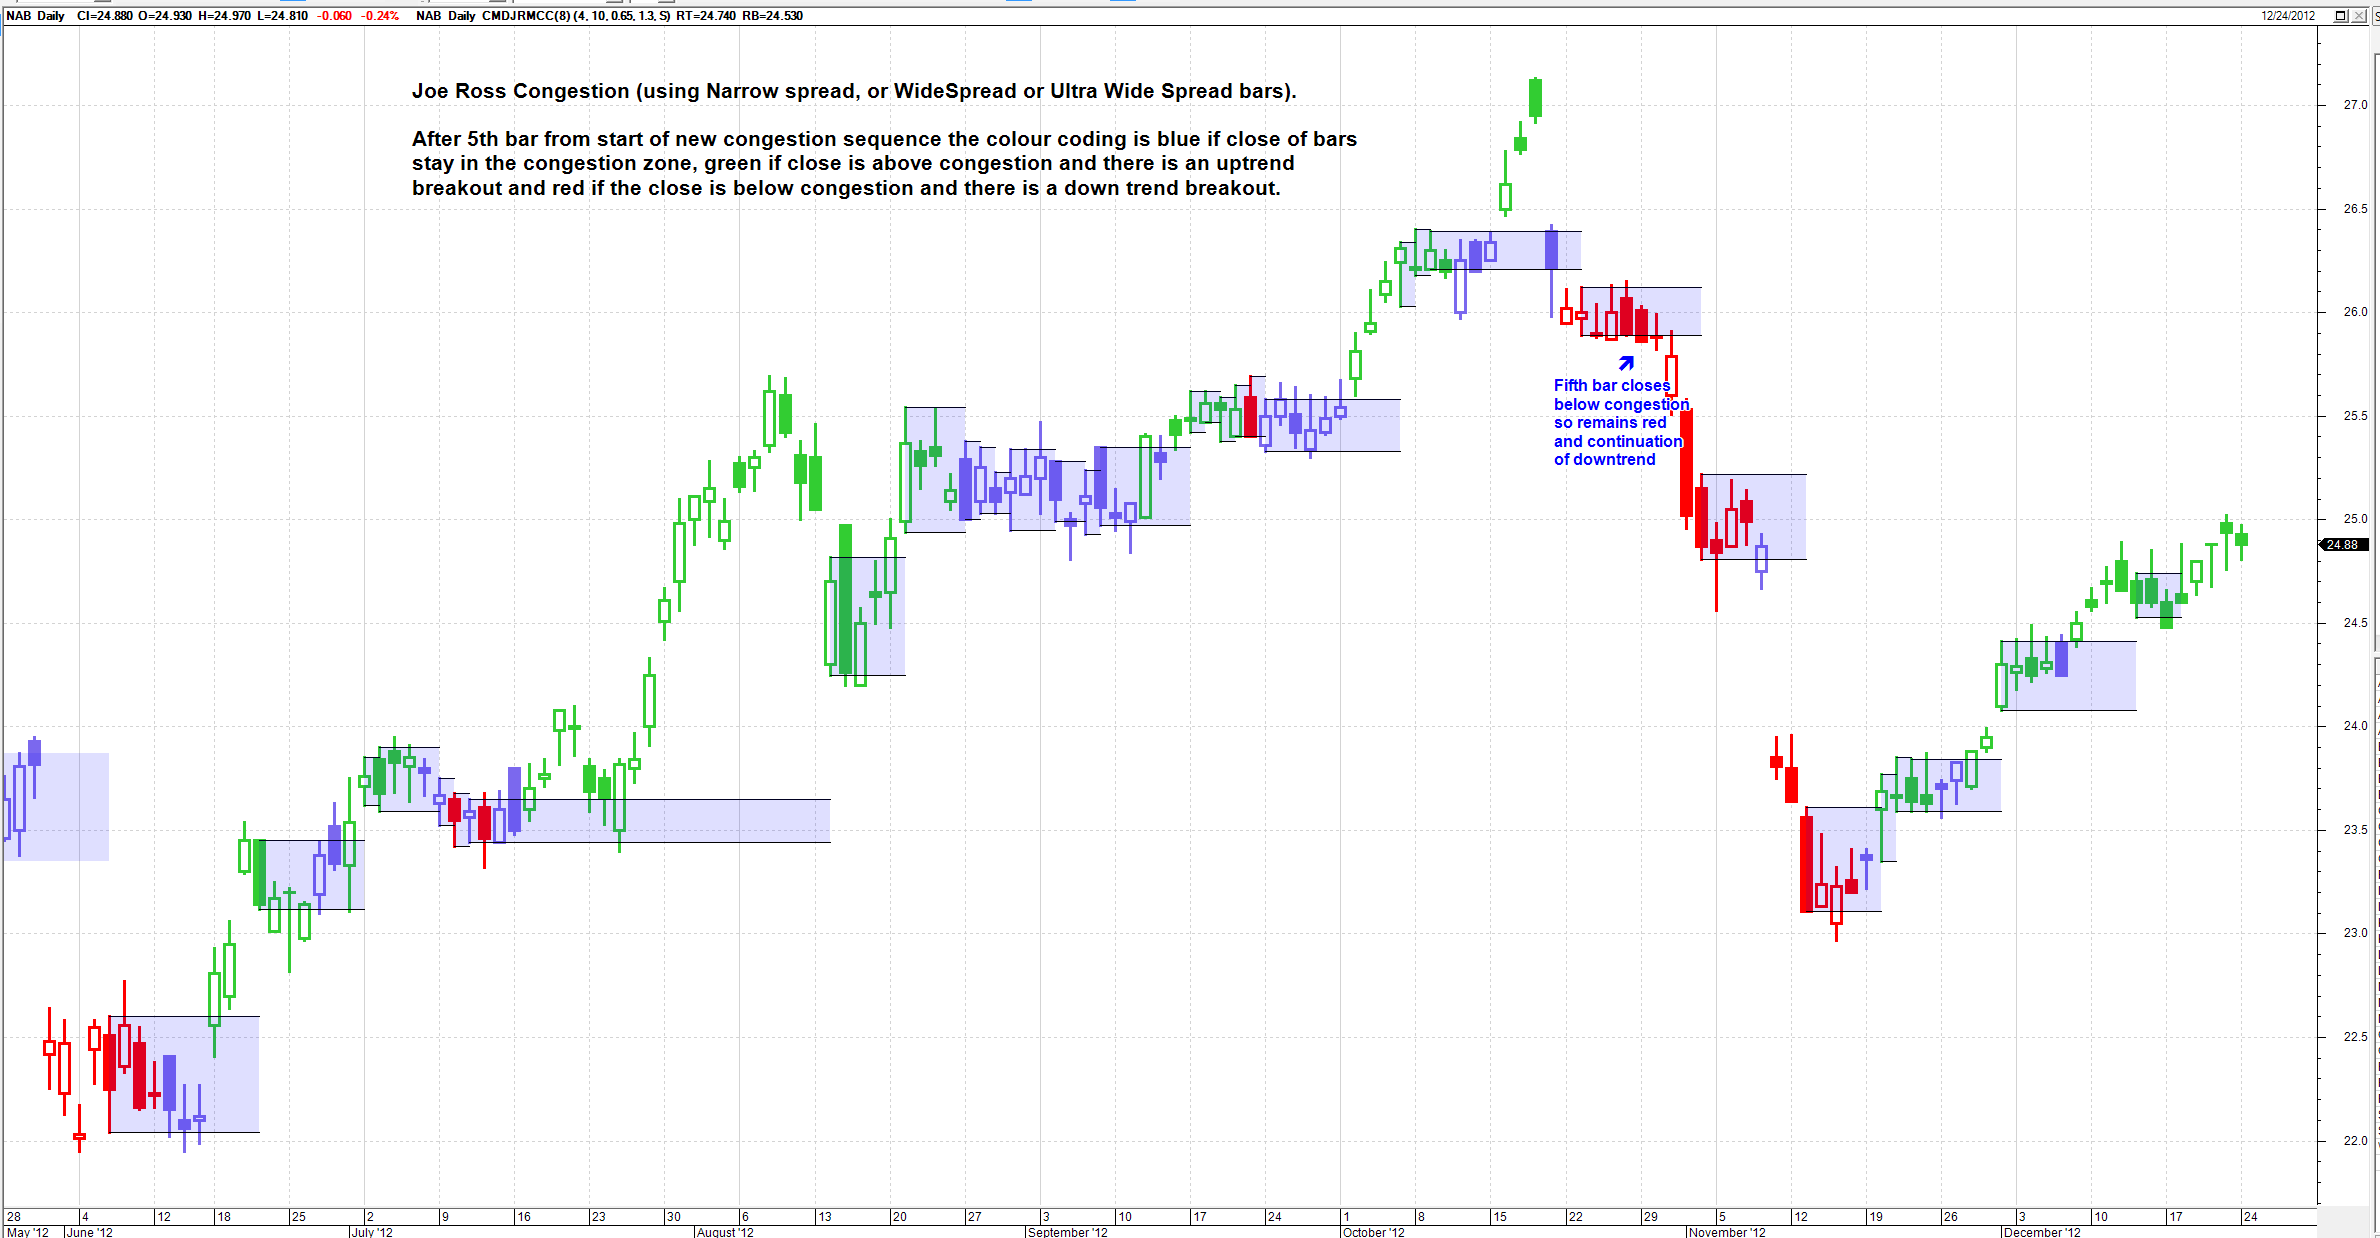
Charlie-B I think this will be is my last post on this subject. Here is a couple of options for the indicator variations where: 1) I colour coded the bars after the 5 bar sequence, Blue if the close of the bars stay in the congestion zone green for upside breakouts and trends, and red for down side breakouts and trends. 2) I also set up an option to show congestion if the starting bar is narrow spread, Widespread or Ultrawidespread. (From a Whyckoff/VSA perspective Ultra widespread is more a climatic indication and Narrow Spread Smart money is in controll feeding enough supply or demand to keep price stable), So you can play with that option if you wish. I was also concerned a bit that a very wide measuring bar is likely to show congestion whereas a nice tredn might be missed e.g. the chart example above. Selecting 4 as the option should give the usuall Joe Ross version of Congestion from any measuring bar. Horizontal shift -4 still required. Indicator seesm to work well on intraday charts. [Description ="Joe Ross Identifying Congestion Chapter 5 Trading the Ross Hook"] [target =price;] [Description ="Joe Ross Identifying Congestion Chapter 5 Trading the Ross Hook"]
MB:= input("Measuring bar 1=NS,2=WS,3=UltraWS, 4 =Combined", 1, 1, 4); prd2:= input("Period for Total Spread MA", 10, 1, 200); Cut:= input("Narrow Spread Cut off", 0.65, .05, 0.8); Cut2:= input("UltraWS Cut off", 1.3, .05, 2.0); method := inputma("Method",SIMPLE); { THExLo:=input("Extreme Low Vol Maximum Threshold", 0.60, .1, 2); THLo:=input("Maximum for Low Vol Threshold", 0.9, .1, 2); THNo:=input("Ultra High Minimum Vol Threshold", 1.5, .1, 2.00);} Range := H - L; NS:=(Range<=Cut* ma(Range,prd2,method)); WS:=(Range>Cut* ma(Range,prd2,method) ) and (Range<Cut2* ma(Range,prd2,method)); UltraWS:=(Range>=Cut2* ma(Range,prd2,method) ); UltraBear:= C<=((Range*0.2)+L); Bear:= C>((Range*0.2)+L) AND C<((Range*0.50)+L); Bull:= C>=((Range*0.50)+L) AND C<((Range*0.80)+L); UltraBull:= C>=((Range*0.80)+L); {------------------------------------------------------------------------------------------}
{ This was the Joe Ross variation to the above formula p.59} a1:= ( If (MB=1,NS, IF (MB=2,WS, If (MB=3,UltraWS, If (MB=4, (NS OR WS OR UltraWS), undefined ))))) AND If(((O<Hist(H,4) and O> Hist(L,4)) OR (C<Hist(H,4) and C> Hist(L,4))) AND ((Hist(O,1)<Hist(H,4) and Hist(O,1)> Hist(L,4)) OR (Hist(C,1)<Hist(H,4) and Hist(C,1)> Hist(L,4))) AND ((Hist(O,2)<Hist(H,4) and Hist(O,2)> Hist(L,4)) OR (Hist(C,2)<Hist(H,4) and Hist(C,2)> Hist(L,4))) AND ((Hist(O,3)<Hist(H,4) and Hist(O,3)> Hist(L,4)) OR (Hist(C,3)<Hist(H,4) and Hist(C,3)> Hist(L,4))),1,0);
{Joe Ross Variation Top Line} [name =RTop line; linestyle=Horz Step; color=Black; width=1;] JRH:= If((a1=1),Hist(H,4) ,Undefined); JRH; {Joe Ross Variation Bottom Line } [name =RBottom Line; linestyle=Horz Step; color=Black; width=1;] JRL:= If((a1=1),Hist(L,4),Undefined); JRL; {R Infill colour on Trends } [name =Ros Congestion Fill color; linestyle=fill Step] [color =Blue] Valuewhen(1,JRH,Hist(H,4)); [color =Blue] Valuewhen(1,JRL,Hist(L,4));
{This section colours the trend after breakouts} [Visible =True;] [target =Price; linestyle=PriceColor] {Colour for Joe Ross Congestion Breaskouts} [color =Lime Green] Close>Valuewhen(1,JRH, Hist(H,4)); [color =Medium Slate Blue] Close<=Valuewhen(1,JRH,Hist(H,4))and Close>=Valuewhen(1,JRL,Hist(L,4)); [color =red] true;
------------- BC User since June 2007 |
Posted By: cmacdon
Date Posted: 26 Dec 2012 at 10:33pm
 ------------- BC User since June 2007 |