AVERAGE DIRECTIONAL INDEX - ADX
Printed From: BullCharts Forum
Category: BullCharts
Forum Name: BullCharts discussion
Forum Discription: General discussion about getting started with BullCharts and exploring its features.
URL: http://www.bullcharts.com.au/forum/forum_posts.asp?TID=10
Printed Date: 12 Jan 2026 at 3:25pm
Software Version: Web Wiz Forums 9.69 - http://www.webwizforums.com
Topic: AVERAGE DIRECTIONAL INDEX - ADX
Posted By: Rhubarb
Subject: AVERAGE DIRECTIONAL INDEX - ADX
Date Posted: 14 Sep 2004 at 3:21pm
|
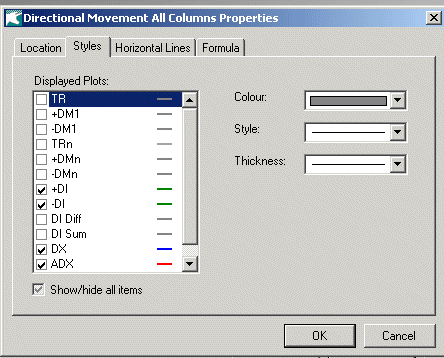
This is one of my most used and valuable trading tools. I see where we have available a group of "Directional Movement" Indicators - however, I would like to see a more conventional indicator where we have the basic 3 lines available in the one set up. 1. The ADX line which measures the strength of the trend - rising, indicating the strength of the trend is increasing ( more directional) while a falling line shows the trend is weakening ( less directional) 2. The plus D1 - showing positive upward directional movement. 3. The minus D1 - showing negative downward directional movement. TRADING To set up we look for the plus D1 to cross over as a precondition and then to trade it when the ADX line crosses up and over the ADX level - here we should be able to set levels between "0" and "50" with an ADX level line at 25 ( to be variable). Whilst it is common to use time periods of 13 or 14 - this feature should also be variable A weekly system should also be available - using compressed data.As usual line colours to be available to assist in easier interpretation. If it is possible to show a suitable "buy" signal when above trading requirements are met - it could then become a most valuable scan tool. I did look at the "combination" Directional Movement Indicator - but found it very difficult to interpret.
------------- Rhubarb 4 All |
Replies:
Posted By: Brendon
Date Posted: 14 Sep 2004 at 6:43pm
|
Ric,
You could try creating a new Indicator using the Builder. Here is a basic starting point of your idea. Time periods and signals can be added to the Bullscript as well. [name=+DI; color=Green] |
Posted By: SimonSavva
Date Posted: 25 Sep 2004 at 11:38am
|
Man, this ADX. I've always been interested in, but it's always so complex. If anyone can direct me to a very concise discription and some examples, I'd be much appreciative. |
Posted By: Seahorse
Date Posted: 25 Sep 2004 at 12:10pm
|
Go to your local newsagency and purchase a copy of....... Issue4 CHARTING "PowerStocks". From the publishers of Shares Magazine. In this magazine Colin Nicholson describes how to use a host of indicators, including the ADX. Cost is $9.95...cheap!!!! ------------- My Reality Check bounced 
|
Posted By: SimonSavva
Date Posted: 26 Sep 2004 at 8:23pm
|
Got myself a copy. BRILLIANT Explanation!! Thankyou Seahorse |
Posted By: SimonSavva
Date Posted: 07 Oct 2004 at 9:14am
| Rhubarb, did you make the conventional indicator? If so I'd love a copy. |
Posted By: davkell
Date Posted: 07 Dec 2004 at 9:14pm
|
For a good explanation of ADX, I'd recommend Alexander Elder's book, "Trading For A Living". It has a very good description of the make-up of ADX and a system for trading it. Besides, if you're trading, you should have this book anyway, it's invaluable!
(Hope you get this reply to your post, I'm a newbie to Bullcharts, currently enjoying my 14day trial.) ------------- "Trade Your Way To Financial Freedom." |

