 |
Locating Strong Stocks |
Post Reply 
|
| Author | |
Bana 
Regular 
Joined: 02 Jan 2007 Location: Australia Posts: 46 |
 Post Options Post Options
 Quote Quote  Reply Reply
 Topic: Locating Strong Stocks Topic: Locating Strong StocksPosted: 08 May 2009 at 2:46pm |
|
Once in a while I randomly pick a book from my bookshelf and read a random chapter to refresh my memory. It so happened that I recently picked up Leon Wilson's - Next Step to Share Trading, chapter 6.
He talks about identifying strong stocks. He goes into much details about customised indicators to study such stocks (which frankly...for me was bit confusing). But overall I liked the 'message' of chapter which I interpreted as - find stocks which have been outperforming the index (RSC), have greater internal strength than index (RSI) and have greater rate of change than the index (ROC). in bullcharts, the first scan for RSC is straight forward. But how do we scan for RSI and ROC of a stock as compared to an index (e.g. XJO)? In the book, he has following search criterias tailored for Metastock: Internal strength comparison search < ="-" ="text/; =utf-8">< name="ProgId" ="Word.">< name="Generator" ="Microsoft Word 11">< name="Originator" ="Microsoft Word 11"> COLUMN A Up:=if(close>ref(close,-1),close-ref(close,-1),0); Down:=if(ref(close,-1)>close,ref(close,-1)-close,0); VALUE:=100-(100/(1+(sum(up,21)/(sum(down+0.0000001,21))))); Mov(value,3,E); We use the "Indicator" reference in Metastock exploration feature to refrence the required index for the search comparison. This can be checked by refereing to the default RSC indicator COLUMN B Down:=if(ref(INDICATOR,-1)>INDICATOR,ref(INDICATOR,-1)-INDICATOR,0); VALUE:=100-(100/(1+(sum(up,21)/(sum(down+0.0000001,21))))); Mov(value,3,E); colA>colB Momentum Comparison Column A Close Column B (((Close-ref(close,-21))/ref(close,-21))*100)-(((Indicator-ref(indicator,-21))/ref(indicator,-21))*100) Filter (((Close-ref(close,-21))/ref(close,-21))*100)-(((Indicator-ref(indicator,-21))/ref(indicator,-21))*100)>=0 |
|
 |
|
maximo 
BullCharts Guru 
Joined: 02 Sep 2006 Location: Australia Posts: 232 |
 Post Options Post Options
 Quote Quote  Reply Reply
 Posted: 09 May 2009 at 6:46pm Posted: 09 May 2009 at 6:46pm |
|
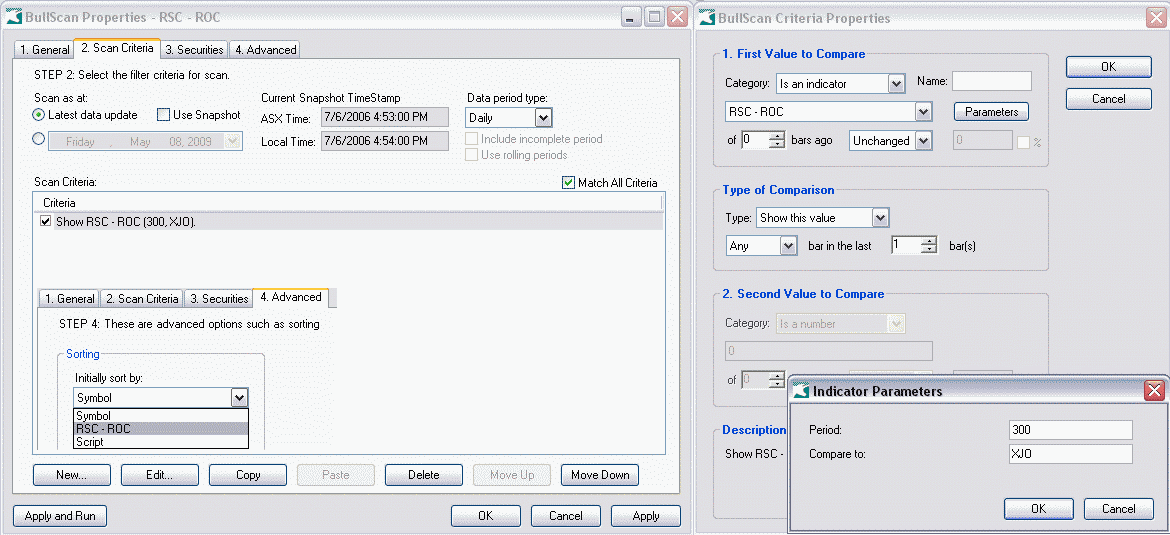
You have great ideas even if they are a random pick off the bookshelf :P An easy and effective trading system approach is to do a strength comparison scan of stocks versus the index. To compare stocks to an index you load the index symbol and apply the same indicator to both the stock and the index then you subtract them to find the difference or strength. Note: The RSI indicator formula doubles the value parameter it is given and subtracts 1. so the default value 28 is actually using a 55ema.
Indicator 1:
{ RSC - ROC }
period:= input("Period",300,1);symb := inputsymbol("Compare to", "XJO");
index:= LoadSymbol(symb,C);ROCrsc:= ROC(C,period,%) - ROC(index,period,%);ROCrsc; Indicator 2:
{ RSC - RSI }
period:= input("Period",28,1);symb := inputsymbol("Compare to", "XJO");index:= LoadSymbol(symb,C);RSIrsc:=RSI( C,period) - RSI(index,period);RSIrsc Edited by maximo - 09 May 2009 at 9:58pm |
|
 |
|
maximo 
BullCharts Guru 
Joined: 02 Sep 2006 Location: Australia Posts: 232 |
 Post Options Post Options
 Quote Quote  Reply Reply
 Posted: 09 May 2009 at 6:54pm Posted: 09 May 2009 at 6:54pm |

|
|
 |
|
maximo 
BullCharts Guru 
Joined: 02 Sep 2006 Location: Australia Posts: 232 |
 Post Options Post Options
 Quote Quote  Reply Reply
 Posted: 09 May 2009 at 10:12pm Posted: 09 May 2009 at 10:12pm |
|
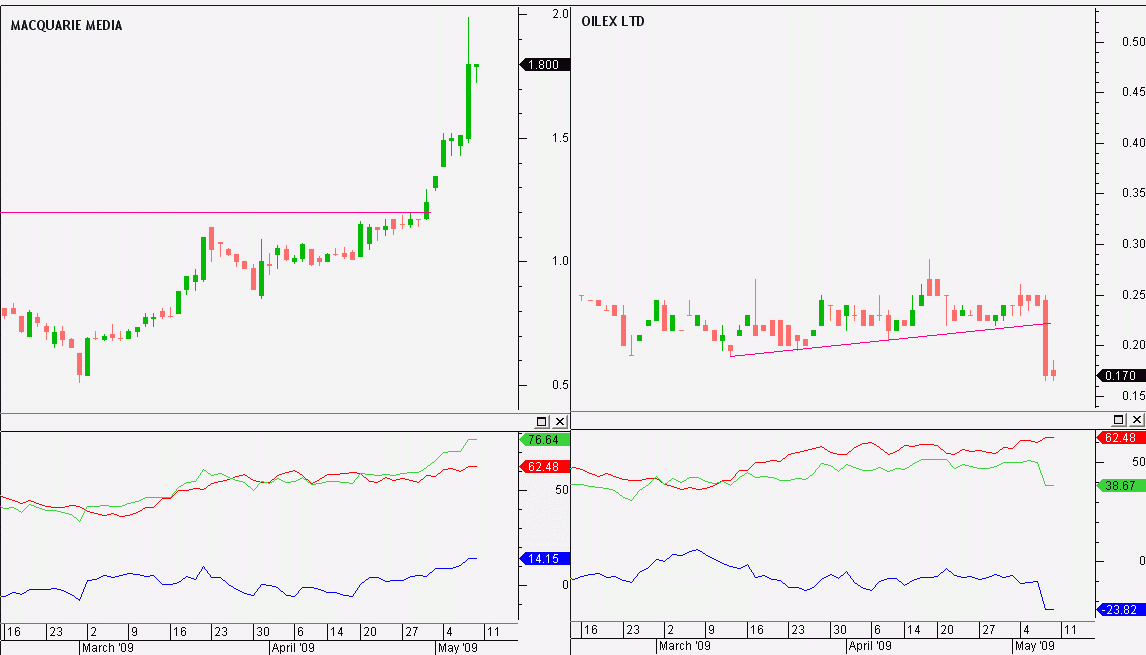
From the resulting scan of the RSI comparison I did a screen capture of the strongest and weakest stock in the list from the ASX300. Made another indicator to show all 3 RSI lines. Red=Index, Green=Stock, Blue=difference or strength. You can now see what is going on when they are subtracted. The strongest stock is doing better than the index by 14% while the weakest is below -23%. The red/green lines show the strongest one has been stronger than the index for about 2 weeks while the weakest one has been weaker for about 2 months. { RSC - RSI plot 3 } period:= input("Period",28,1);symb := inputsymbol("Compare to", "XJO");index:= LoadSymbol(symb,C);[color =red]indexRSI:= RSI(index,period); indexRSI; [color =lime green]stockRSI:= RSI( C,period);stockRSI; [color =blue]RSIrsc:= stockRSI - indexRSI; RSIrsc
 Edited by maximo - 10 May 2009 at 2:54pm |
|
 |
|
maximo 
BullCharts Guru 
Joined: 02 Sep 2006 Location: Australia Posts: 232 |
 Post Options Post Options
 Quote Quote  Reply Reply
 Posted: 10 May 2009 at 2:16pm Posted: 10 May 2009 at 2:16pm |
|
Here's Leon Wilsons internal strength indicator converted. It looks to be an 11 period RSI formula (really 21ema) with 3 period smoothing. I changed it to a subtraction result as this is more useful, like hedge fund analysis. ie. Long a number of strong stocks, Short a number of weak stocks. The scan is set up the same way as above. { RSC - internal }
[Description="Leon Wilson's - Next Step to Share Trading, chapter 6."]
period:= input("Period",21,1);smooth:= input("Smoothing",3,1);symb := inputsymbol("Compare to", "XJO");ind:= LoadSymbol(symb,C);{ COLUMN A: Stock } Up:= if(close>ref(close,-1),close-ref(close,-1),0);Down:= if(ref(close,-1)>close,ref(close,-1)-close,0);VALUE1:=100-(100/(1+( sum(up,period)/(sum(down+0.0000001,period)))));Stock:= Ma(value1,smooth,E);{ COLUMN B: Index } iUp:= if(ind>ref(ind,-1),ind-ref(ind,-1),0);iDown:= if(ref(ind,-1)>ind,ref(ind,-1)-ind,0);VALUE2:=100-(100/(1+( sum(iup,period)/(sum(idown+0.0000001,period)))));Index:= Ma(value2,smooth,E);Stock - Index;
Edited by maximo - 10 May 2009 at 3:08pm |
|
 |
|
Bana 
Regular 
Joined: 02 Jan 2007 Location: Australia Posts: 46 |
 Post Options Post Options
 Quote Quote  Reply Reply
 Posted: 10 May 2009 at 9:46pm Posted: 10 May 2009 at 9:46pm |
|
Hello Maximo
Thanks for the response and formulas. Works like a treat. Going to play with it now. Cheers Bana Edited by Bana - 10 May 2009 at 10:07pm |
|
 |
|
Bana 
Regular 
Joined: 02 Jan 2007 Location: Australia Posts: 46 |
 Post Options Post Options
 Quote Quote  Reply Reply
 Posted: 10 May 2009 at 11:30pm Posted: 10 May 2009 at 11:30pm |
|
Hello Maximo
Thanks again for the help above. I think I owe you the results. This is what I have done - Using your above scans, I created a combined scan of: RSCN>0 RSC-ROC>0 RSC-RSI>0 Search - All Ords {I had some discrepancies with RSCN scan results a few months ago and Bullcharts support told me to change "Number of bars to load", under "Advanced tab", from automatically to a high number e.g. 10,000. This solved the problem. So I did the same setting for this scan} This gave me over 140 results. Since I am after the strongest stocks, I looked at only the top 10 stocks of each attribute i.e 30 stocks in total. Now I am now looking for any pattern which might let me ride on one or more of these 30 stocks. I am looking for trend continuations or breakouts. Below is the shortlist from the 30 stocks - Starting with RSC - KAR (Flag), LNC (Flag), MRU (steep but stable trend, compatible with trendline and CBL, CMW (BO from consolidation), MND (steep but stable trend) RSI = KAR (as above), MRU (as above), ORG (trend/channel) ROC = KAR, CUS (breakout), LNC, MRU, ESG (breakout), ORG Common in all categories - KAR, MRU Common in at least 2 categories - LNC, ORG Edited by Bana - 11 May 2009 at 12:13am |
|
 |
|
Bana 
Regular 
Joined: 02 Jan 2007 Location: Australia Posts: 46 |
 Post Options Post Options
 Quote Quote  Reply Reply
 Posted: 10 May 2009 at 11:42pm Posted: 10 May 2009 at 11:42pm |
|
All results of above scan
Symbol RSCN RSC - RSI RSC - ROC AAH 1.702 4.634 69.969 ABB 1.307 3.038 25.297 AGG 0.023 3.257 59.527 AGK 1.219 3.224 63.099 AGO 4.818 2.697 9.36 AGP 5.296 8.752 17.485 AGS 2.58 2.158 13.281 AND 3.794 4.254 7.309 ANZ 0.273 0.603 4.215 AOE 14.186 5.519 82.486 APA 0.127 1.143 18.635 ARP 1.436 1.956 7.173 ARU 2.424 2.61 15.511 ASX 1.016 2.066 10.445 ATR 5.476 0.554 14.832 AUB 1.069 2.949 27.995 AWE 3.482 2.371 11.23 AXA 0.459 1.15 4.777 BBG 1.757 1.309 10.847 BHP 2.322 2.803 18.472 BKL 1.115 1.342 5.638 BKW 1.172 2.046 40.935 BLD 0.583 0.494 2.604 BOC 2.157 1.994 22.673 BUL 1.82 4.522 61.76 BWP 0.487 1.656 18.291 CBA 0.293 1.255 16.466 CCL 0.751 2.872 22.503 CDP 0.552 0.954 9.958 CDU 1.459 2.286 3.225 CFE 1.929 4.204 62.516 CFX 0.091 0.171 0.486 CGG 0.004 2.895 5.856 CGX 2.428 4.059 18.14 CIX 1.462 1.585 16.165 CMW 9.345 0.855 1.26 CNA 3.812 2.604 15.25 CNX 1.582 4.624 181.413 COF 3.996 1.01 10.288 COH 0.711 1.301 19.447 CSL 2.598 2.265 15.698 CST 8.305 3.568 49.26 CTX 2.764 0.41 0.882 CTY 0.356 8.281 23.626 CUS 0.076 5.05 245.437 CUV 1.923 1.615 26.319 CVN 2.18 5.444 50.139 CZA 0.47 4.928 8.754 DJS 1.374 2.91 21.359 DMP 0.346 2.235 21.965 DOM 8.72 5.031 37.215 DOW 0.981 1.644 11.283 DTL 0.713 2.623 14.93 DYE 4.286 2.702 5.451 ERA 7.826 3.524 33.117 ESG 3.075 5.282 151.178 FAN 2.269 1.918 5.546 FLX 1.089 3.644 39.699 FRI 1.429 3.484 21.568 FWD 3.605 2.685 16.365 GBG 2.632 2.694 27.485 GCL 5.206 2.414 4.26 GOW 0.258 1.885 17.324 GWT 0.028 1.407 13.165 HSP 8.305 0.384 1.687 IMF 5.332 10.81 223.903 IRE 1.427 3.167 27.613 IVC 1.227 1.82 5.189 JBH 3.714 4.056 49.674 KAR 33.623 8.057 178.698 KCN 5.239 4.051 77.086 LEP 0.83 0.667 12.713 LNC 15.226 3.73 230.879 LNG 2.139 2.657 36.952 LNN 2.252 6.544 51.25 LWB 0.504 2.936 29.931 MIN 3.127 2.924 2.593 MML 4.286 5.618 50.742 MND 9.133 2.887 16.318 MPO 0.23 3.021 58.89 MRM 1.477 3.657 31.26 MRU 14.629 7.956 86.26 MSB 0.027 0.829 25.71 MTS 7.992 1.914 25.663 NCM 6.743 2.94 8.387 NEM 0.062 2.525 29.8 NHC 4.538 5.453 96.266 NHF 0.146 1.594 7.145 NMS 3.07 2.971 17.632 NUF 2.22 3.162 16.69 NVT 0.047 3.558 54.523 NZO 5.48 3.756 36.38 OMH 7.533 3.463 42.111 ORG 8.407 5.978 119.496 ORI 1.512 1.657 1.747 ORL 0.983 3.348 27.507 OSH 1.727 3.69 57.831 PDN 23.664 2.301 2.38 PPP 0.844 5.162 67.661 PRC 0.597 3.502 18.585 PRU 3.926 2.944 8.184 PVE 0.509 2.836 23.78 PWK 7.396 3.416 15.307 PXS 3.735 3.584 29.26 QBE 1.565 1.535 27.532 REA 5.918 2.908 18.98 REH 3.334 1.781 8.098 RFG 1.181 3.902 25.579 RHC 7.626 1.781 13.848 RIC 0.268 0.618 2.067 RIV 70.968 3.466 16.403 RMD 0.519 2.873 54.318 SAI 0.284 1.847 23.806 SGH 0.847 4.495 37.368 SGT 0.208 2.131 16.589 SGX 2.818 2.517 1.347 SHL 0.568 0.701 10.236 SLM 0.577 3.048 39.848 SLX 0.953 3.37 25.896 SOL 1.222 2.96 54.684 SOT 0.06 1.073 30.165 SRX 0.365 3.511 15.012 SST 4.035 14.133 54.26 STO 2.485 3.53 61.741 SUL 0.272 3.317 26.319 TAL 0.421 1.876 25.479 TFC 3.842 3.841 35.728 TGR 1.603 1.505 1.955 TOL 3.87 1.479 3.135 TRS 3.756 2.948 21.138 UGL 4.55 1.089 10.023 UMC 5.178 3.048 32.658 WBC 0.599 1.878 17.596 WEB 0.989 3.437 29.705 WOW 3.187 2.35 19.498 WPL 2.484 2.4 6.278 WSA 21.175 2.679 17.427 WTF 0.629 3.309 26.034 |
|
 |
|
Bana 
Regular 
Joined: 02 Jan 2007 Location: Australia Posts: 46 |
 Post Options Post Options
 Quote Quote  Reply Reply
 Posted: 10 May 2009 at 11:55pm Posted: 10 May 2009 at 11:55pm |
|
Added a volume criteria to the scan, to filter out the small illiquid stocks - 50 day EMA > 750,000. This reduced the scan results from 138 to 54.
Flags seems to be in season. A couple which did not make it to the 30's shortlist, but look noteworthy:  Edited by Bana - 11 May 2009 at 12:14am |
|
 |
|
maximo 
BullCharts Guru 
Joined: 02 Sep 2006 Location: Australia Posts: 232 |
 Post Options Post Options
 Quote Quote  Reply Reply
 Posted: 11 May 2009 at 5:53pm Posted: 11 May 2009 at 5:53pm |
|
G'day Bana,
Thanks for posting those excellent analysis techniques to go with RSC.
I add a liquidity filter too when scanning outside the ASX300, great work!
The market is giving us so many good opportunities at the moment.
Cheers
Max
Edited by maximo - 12 May 2009 at 3:30pm |
|
 |
|
Post Reply 
|
| Forum Jump | Forum Permissions  You cannot post new topics in this forum You cannot reply to topics in this forum You cannot delete your posts in this forum You cannot edit your posts in this forum You cannot create polls in this forum You cannot vote in polls in this forum |