XXX Indicator |
Post Reply 
|
| Author |
 Printable Version Printable Version Delicious Delicious Digg Digg Facebook Facebook Furl Furl Google Boomarks Google Boomarks Google Buzz Google Buzz MySpace MySpace Newsvine Newsvine reddit reddit StumbleUpon Translate StumbleUpon Translate Twitter Twitter Windows Live Windows Live Yahoo Bookmarks Yahoo Bookmarks Topic Search Topic Search  Topic Options Topic Options
|
peter1 
Regular 
Joined: 27 Aug 2008 Location: Sydney Posts: 56 |
 Post Options Post Options
 Quote Reply Quote Reply
 Topic: XXX Indicator Topic: XXX IndicatorPosted: 19 Jul 2012 at 4:12pm |
|
It looks like a volatility envelope that form bands both sides of a moving average.
|
|
 |
|
|
noumann
Newbie 
Joined: 07 Jul 2012 Posts: 2 |
Post Options
Quote Reply
Posted: 10 Jul 2012 at 6:34am |
|
Hi everyone,
I'm trying to understand what kind indicator is this,plotted on the monthly chart of eurostoxx 50. The author says that it is based on range,volatility and the position of the closes in the last n bars and that it works on any time frame without modifications(so i presume it's adaptive) .When High touches the upper band(blue line) a buy signal is given,when low touches the lower band(red) a sell signal is given.Furthermore,in the graph you can see two grey lines:If we are long and prices(low) touch the lower grey line,the market becomes neutral;if we are short and prices(high)touch the upper grey line,the market becomes neutral. In other words,the indicator gives, at the end of every period, the levels of trend changes for the next period.I don't know other.Is there anybody familiar with it? Thank you all and forgive my poor english 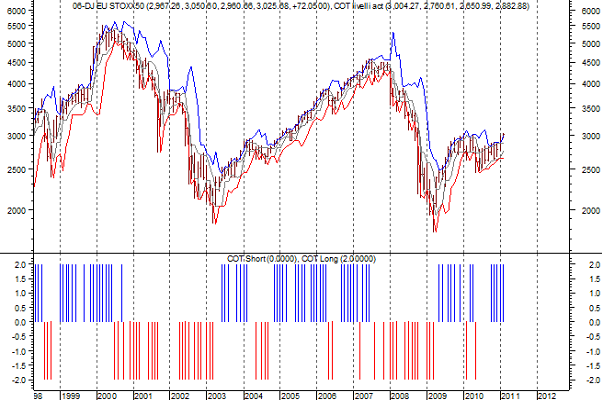 |
|
|
|
|
Post Reply
|
| Forum Jump | Forum Permissions You cannot post new topics in this forum You cannot reply to topics in this forum You cannot delete your posts in this forum You cannot edit your posts in this forum You cannot create polls in this forum You cannot vote in polls in this forum |


