Volume Spread Analysis |
Post Reply 
|
Page 12> |
| Author |
 Printable Version Printable Version Delicious Delicious Digg Digg Facebook Facebook Furl Furl Google Boomarks Google Boomarks Google Buzz Google Buzz MySpace MySpace Newsvine Newsvine reddit reddit StumbleUpon Translate StumbleUpon Translate Twitter Twitter Windows Live Windows Live Yahoo Bookmarks Yahoo Bookmarks Topic Search Topic Search  Topic Options Topic Options
|
joea 
Newbie 
Joined: 15 Nov 2011 Location: Miallo Posts: 19 |
 Post Options Post Options
 Quote Reply Quote Reply
 Topic: Volume Spread Analysis Topic: Volume Spread AnalysisPosted: 22 Sep 2012 at 6:32pm |
|
In follow up to my last post.
http://stockcharts.com/help/doku.php?id=chart_school:market_analysis:wyckoff2 The above link show an explanation for those that are interested. joea |
|
 |
|
|
joea
Newbie
Joined: 15 Nov 2011 Location: Miallo Posts: 19 |
Post Options
Quote Reply
Posted: 22 Sep 2012 at 3:44pm |
|
cmacdon
I compliment you on your ability to get your head around VSA, and your coding ability. In the case of this stock, you are correct in your comments. If anyone has "Charting the stock market", they will see this explained on page 91. It actually shows how the climax and preliminary support takes place. In the case of this stock there was no prompt rally, after the correction, as such. By this I mean, there was no volume building. However in August the volume came in and the stock made a significant rise. joea |
|
|
|
|
jazza
Regular 

Joined: 10 Aug 2007 Posts: 33 |
Post Options
Quote Reply
Posted: 19 Sep 2012 at 12:59pm |
|
Hi Cmacdon,
Awesome. Thanks for sharing. Will give them a test drive soon. Cheers Jazza |
|
|
|
|
Marco
Newbie

Joined: 29 Mar 2008 Location: Australia Posts: 6 |
Post Options
Quote Reply
Posted: 19 Sep 2012 at 9:26am |
|
That's some great work, Cmacdon. I've wanted to explore VSA in more depth for some time, and this will be very useful.
Appreciate your hard work in getting this coded up. |
|
|
|
|
cmacdon
BullCharts Guru 
Joined: 09 Sep 2012 Location: Brisbane Posts: 236 |
Post Options
Quote Reply
Posted: 19 Sep 2012 at 9:12am |
|
Jazza
One word of warning on scans of particular VSA indicators. THe VSA approach is all about reading the charts in context. You do not rely solely on any one indicator but look for them in the context of what other Signs of Weakness and Signs of strength have gone on in the background. See the Chart below where a valid Bottom reversal on high volume is then followed by the Selling Climax on ULtrahigh Volume. IF you traded solely on scanning a Bottom reversal indicator you would probably have lost some money when the Selling Climax hit. The Bottom reversal signal was followed by a 2 bar rally on light volume (lime green bars) before more supply or high volume entered (Dark Violet bars) the market which then led to the Climatic action red bars. So it is all about understanding the context rather than picking a indicator for a winner. 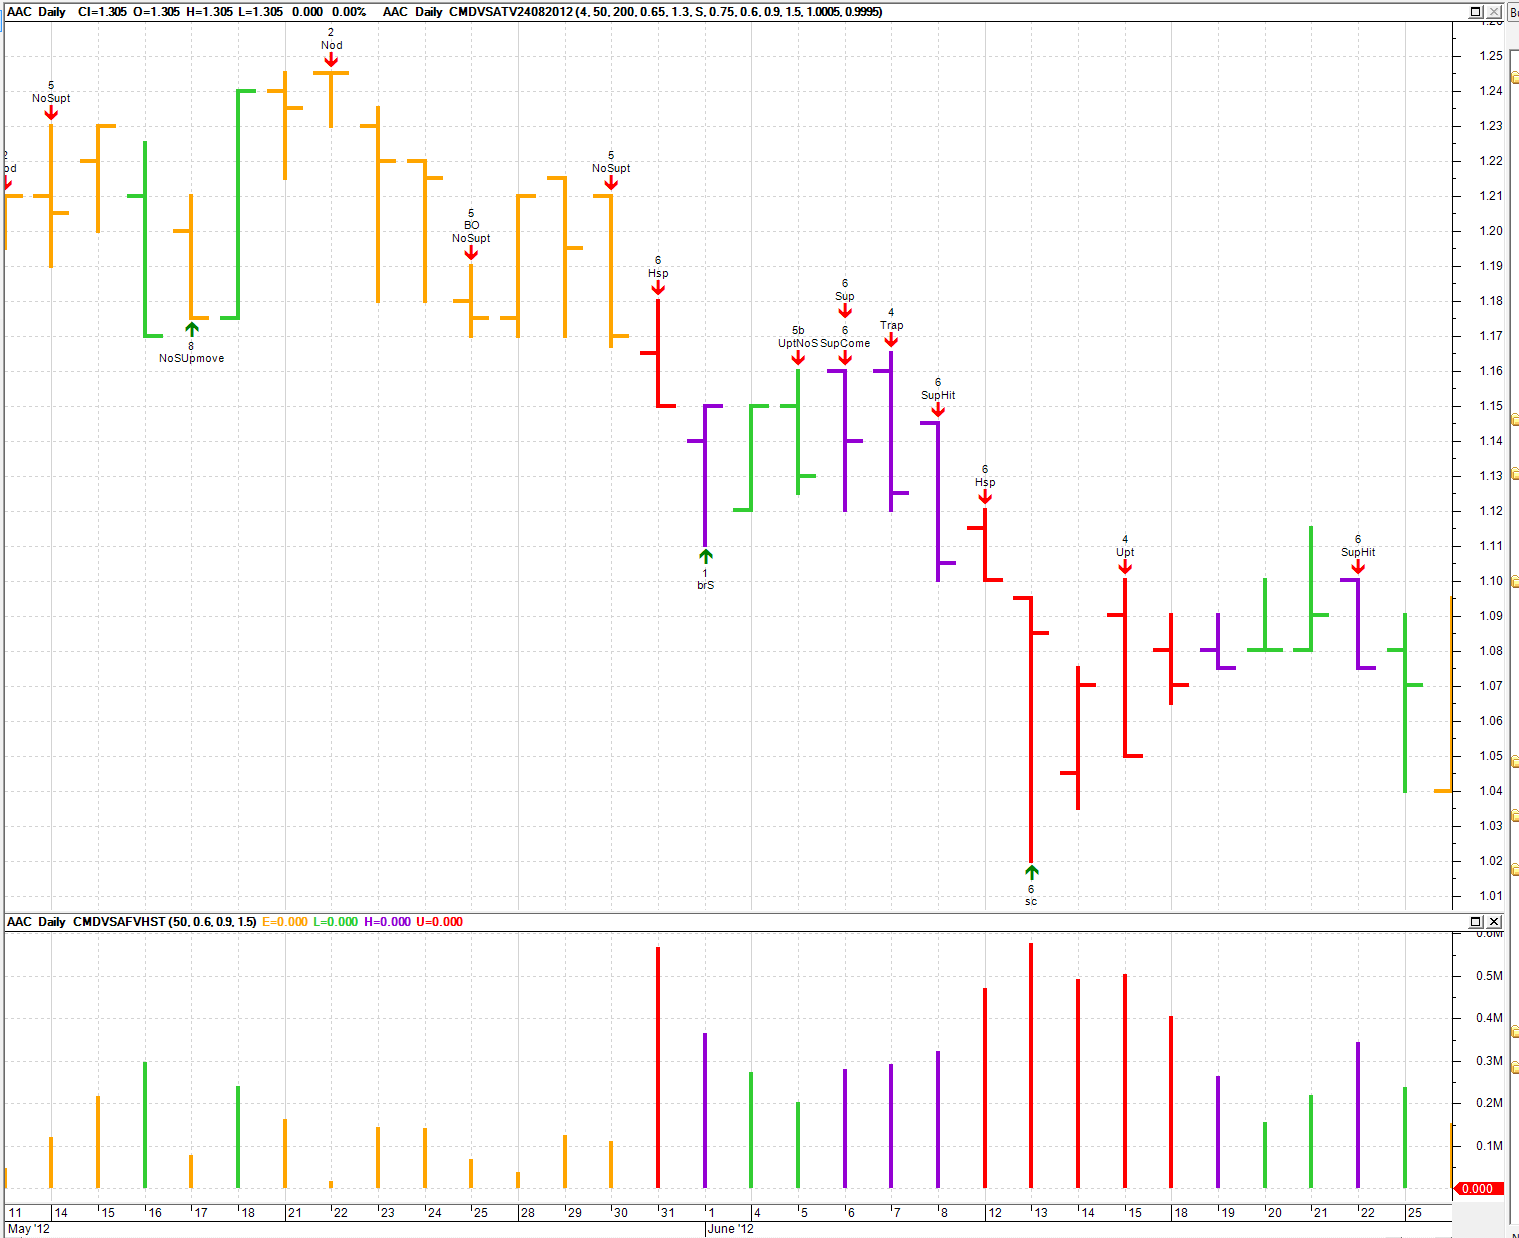 |
|
|
BC User since June 2007
|
|
|
|
|
cmacdon
BullCharts Guru
Joined: 09 Sep 2012 Location: Brisbane Posts: 236 |
Post Options
Quote Reply
Posted: 19 Sep 2012 at 8:37am |
|
Obviously the post boxes doesn't accept two pictures posted together. Here is the Vol scan example.
 |
|
|
BC User since June 2007
|
|
|
|
|
cmacdon
BullCharts Guru
Joined: 09 Sep 2012 Location: Brisbane Posts: 236 |
Post Options
Quote Reply
Posted: 19 Sep 2012 at 8:35am |
|
Jazza
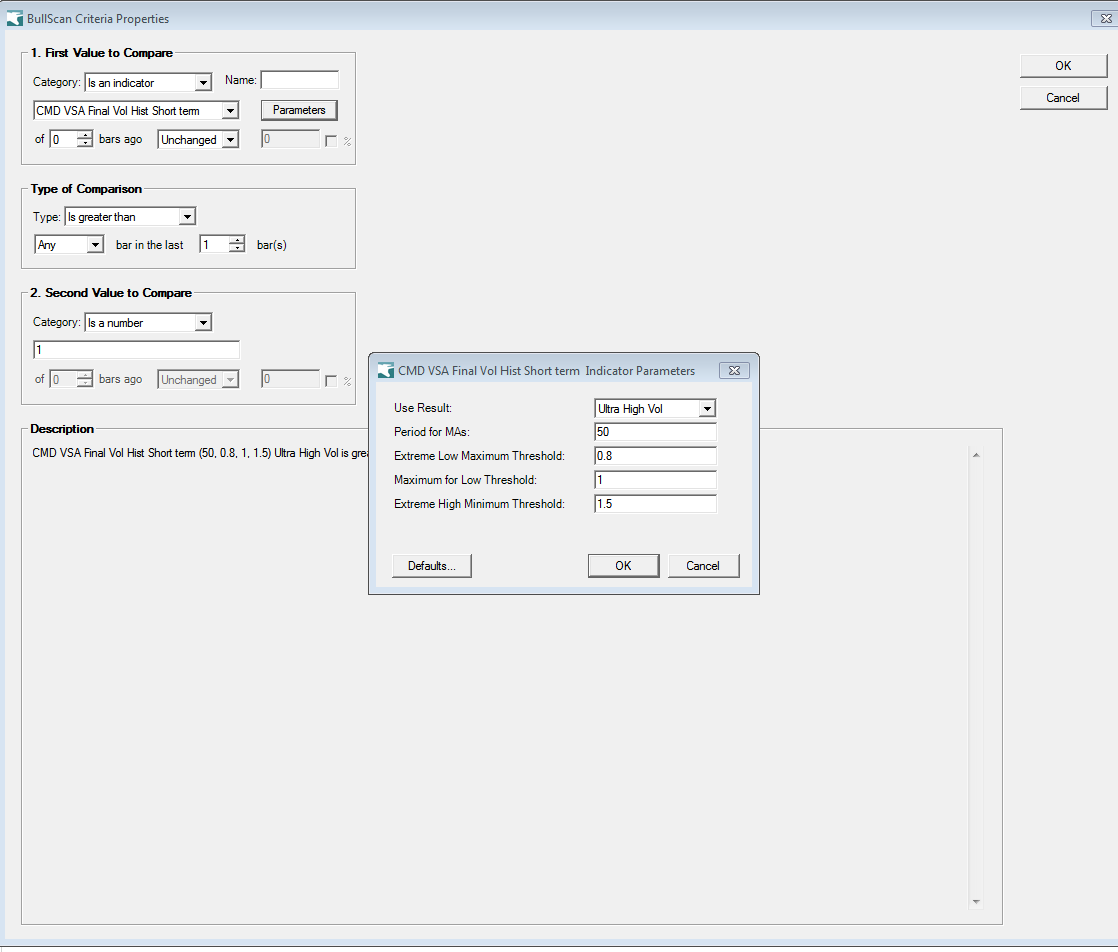
The scans are easy you then just use select Indicator signal. See two scan pictures below . If I have posted them in the right order, The first is selecting a particular VSA signal from the main indicator - in t5his case Bottom reversal with Supply present. The second uses scan on the VSA coloured volume indicator to find stocks with ultrahighvol . 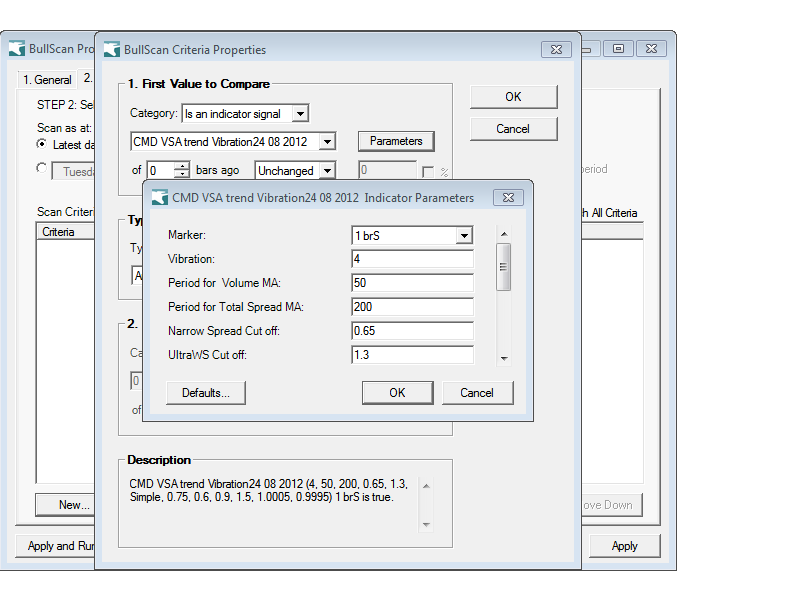 |
|
|
BC User since June 2007
|
|
|
|
|
jazza
Regular
Joined: 10 Aug 2007 Posts: 33 |
Post Options
Quote Reply
Posted: 19 Sep 2012 at 1:27am |
|
Hi Cmacdon, Wow, a wealth of information contained in your VSA posts. Great info on Wyckoff and Williams and some serious coding there! I have made a template from your formulas supplied. Great top and bottom reversal signals. How easy/difficult would it be to construct a Bullscan of the reversal signals?
|
|
|
|
|
cmacdon
BullCharts Guru
Joined: 09 Sep 2012 Location: Brisbane Posts: 236 |
Post Options
Quote Reply
Posted: 17 Sep 2012 at 7:18pm |
|
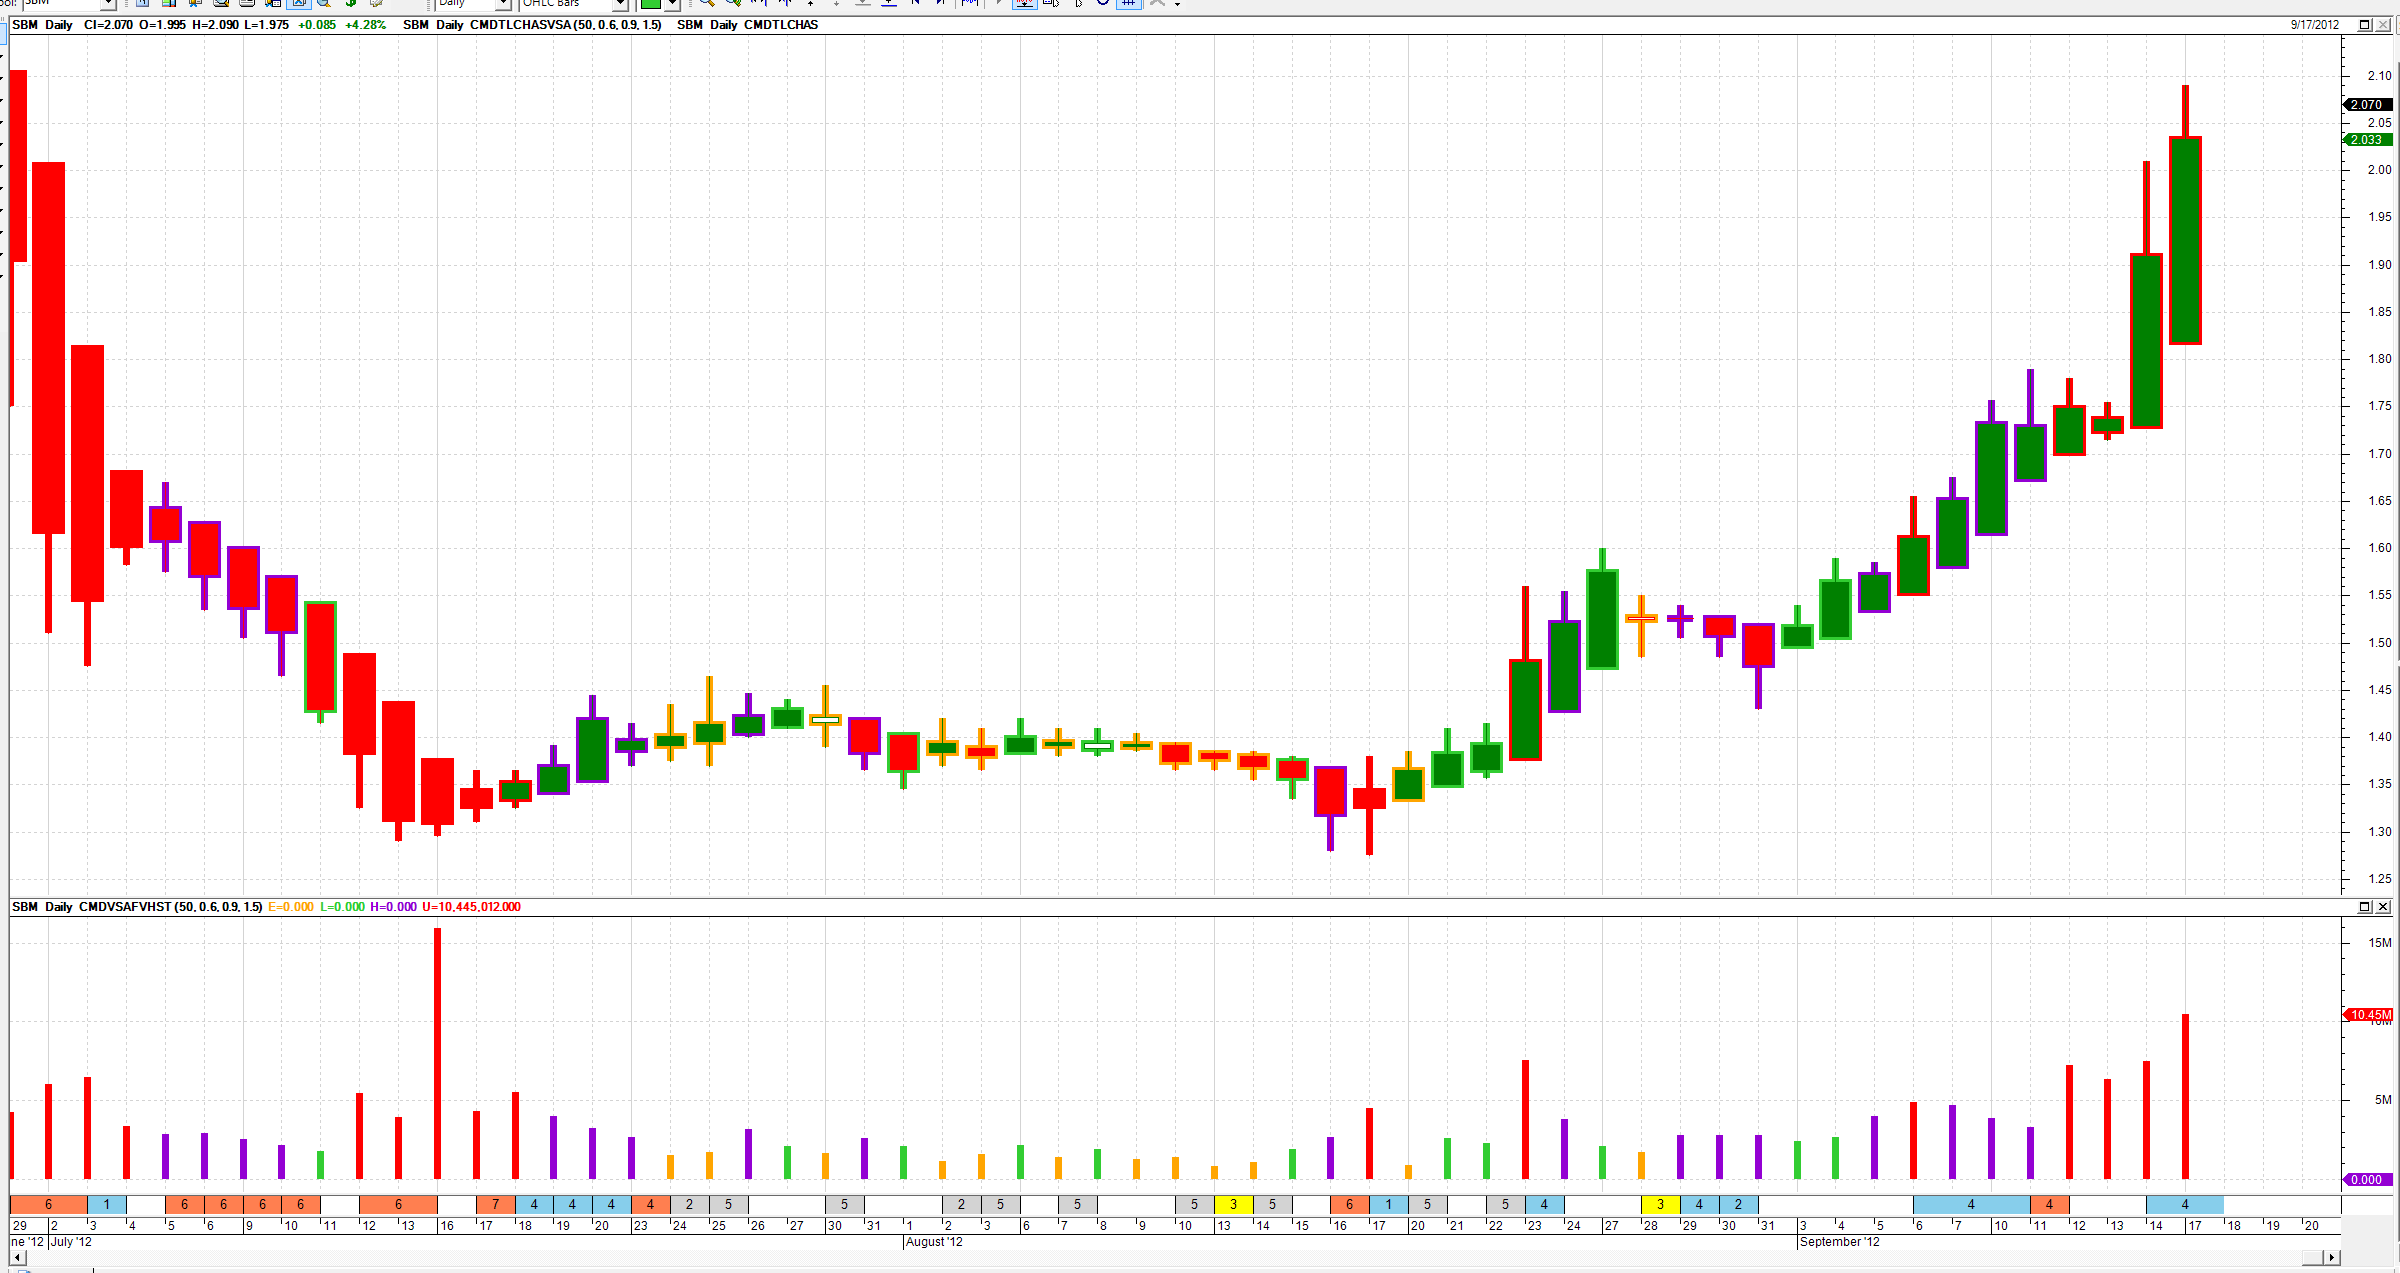
Here is a neat fusion. Puttimg the VSA coloure Heikin Ashi bars on first then opening the green up and red down HA solid couour inidcator gives a chart where the Heikin Ashi trend bars are shown in the colour of the solid body of the HA bars, and the VSA relative Volume colours appear as the colour of the tails or the body outline; so, provides best of both worlds.
 |
|
|
BC User since June 2007
|
|
|
|
|
cmacdon
BullCharts Guru
Joined: 09 Sep 2012 Location: Brisbane Posts: 236 |
Post Options
Quote Reply
Posted: 17 Sep 2012 at 2:59pm |
|
Sorry
That was SBM not BHP with coloure HA/VSA Volume bars 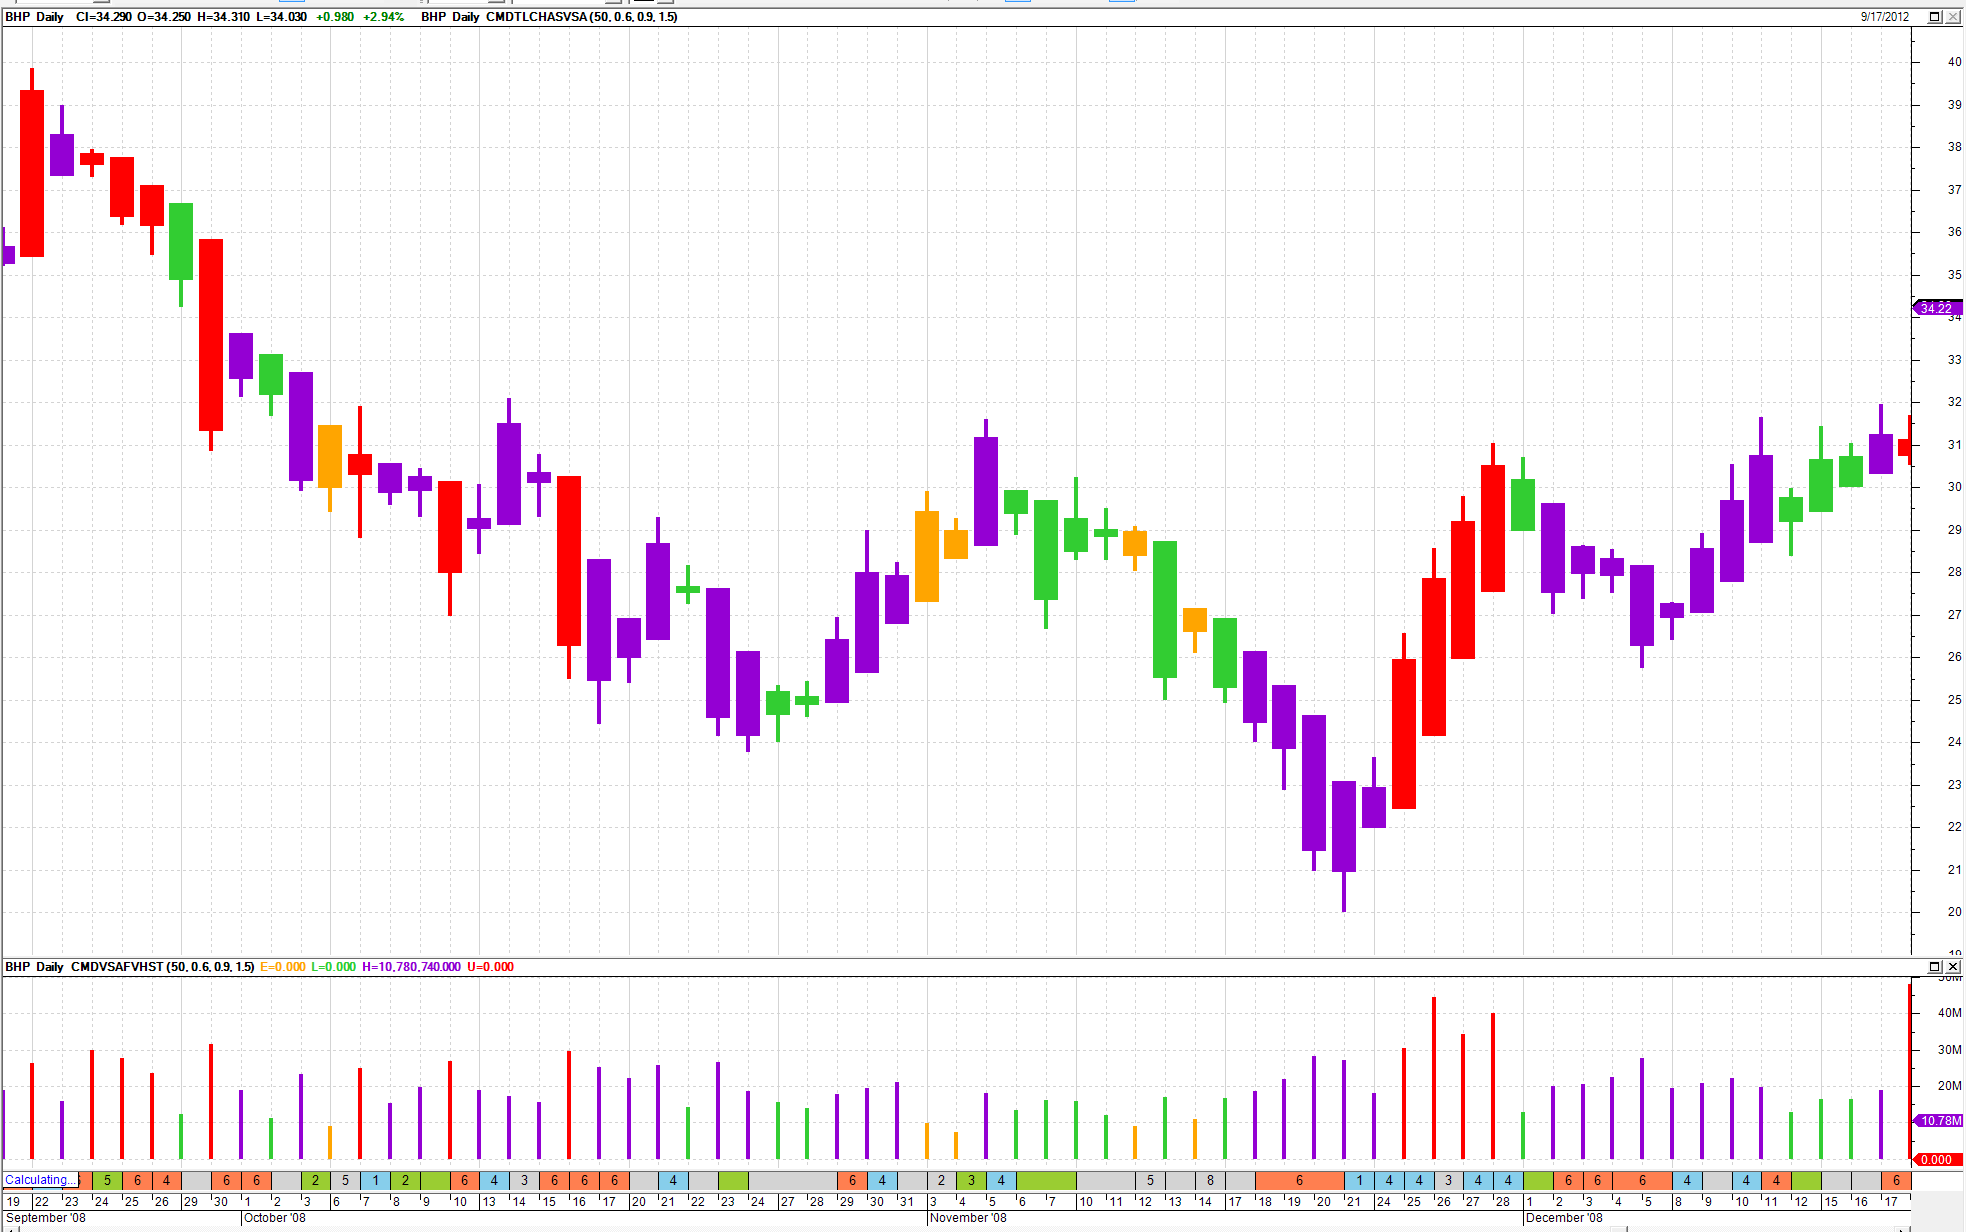 |
|
|
BC User since June 2007
|
|
|
|
|
Post Reply
|
Page 12> |
| Forum Jump | Forum Permissions You cannot post new topics in this forum You cannot reply to topics in this forum You cannot delete your posts in this forum You cannot edit your posts in this forum You cannot create polls in this forum You cannot vote in polls in this forum |


