 |
"Who is in charge of price action?" |
Post Reply 
|
| Author | |
cmacdon 
BullCharts Guru 
Joined: 09 Sep 2012 Location: Brisbane Posts: 236 |
 Post Options Post Options
 Quote Quote  Reply Reply
 Topic: "Who is in charge of price action?" Topic: "Who is in charge of price action?"Posted: 30 Jul 2014 at 10:51am |
|
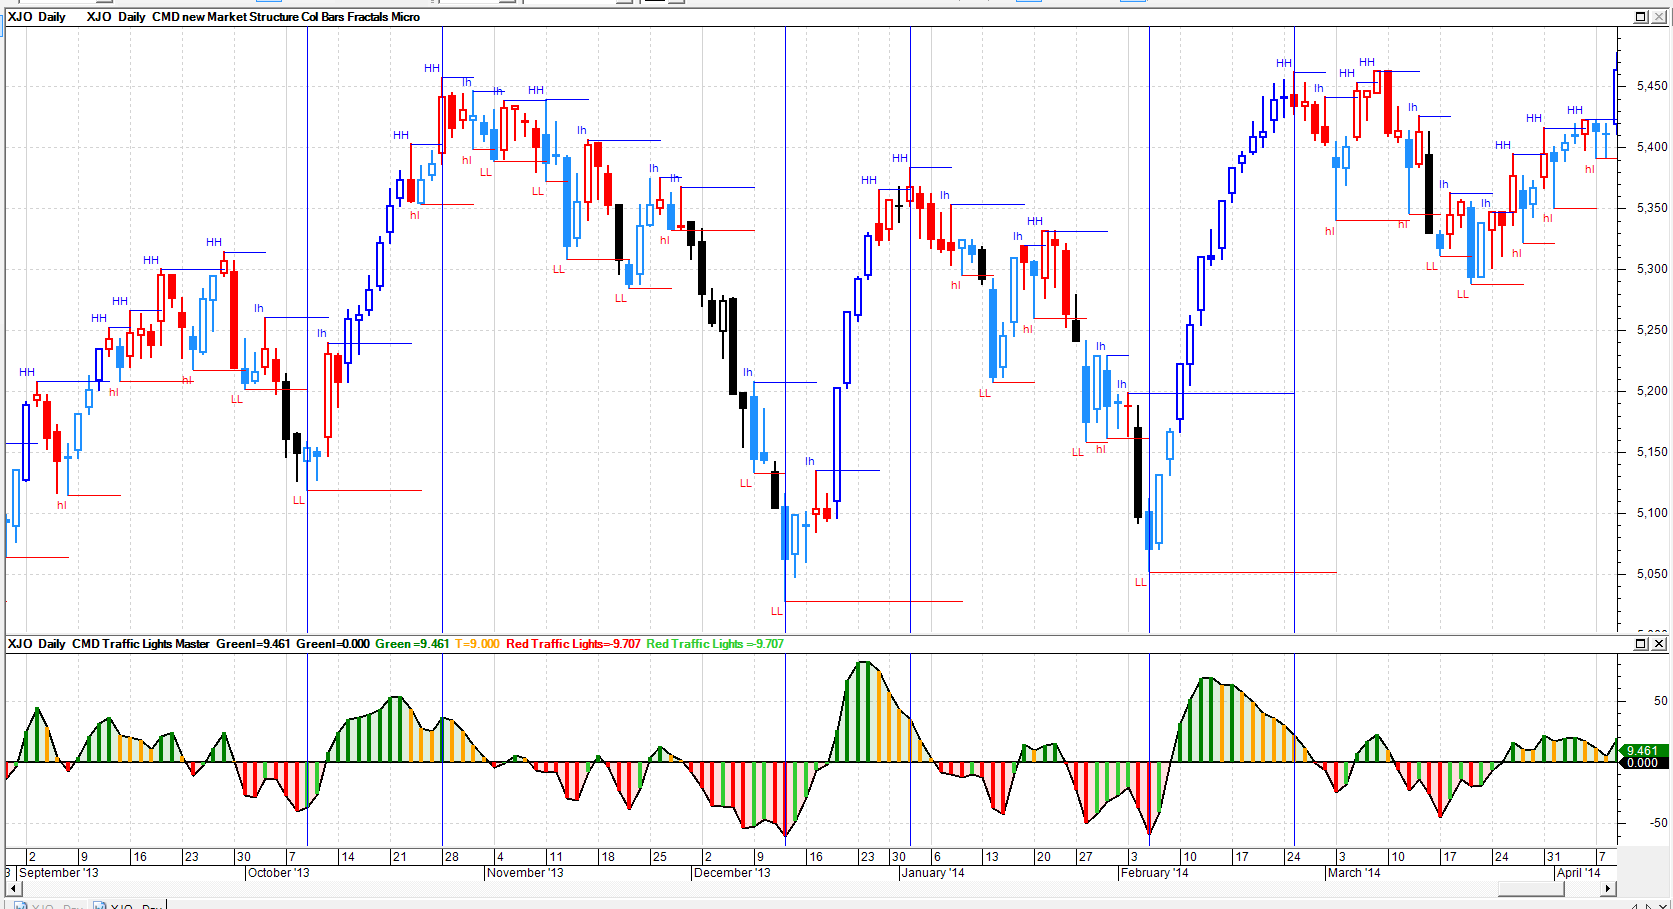
I was trying to compare various approaches to interpreting who is in charge of the market against the price action market structure. In the forum there has been mentioned in various posts Larry Williams and Tom Williams and William Garret’s interpretation of buying and selling within and across bars and there are also interpretations of who is in charge based on candle body sizes and candle body colours and similalry for Heikin Ashi bars. When you try to apply a number of indicators for these approaches even on large screens the space you have left showing the price action structure can get squeezed and distorted which can defeat the objective. Here is an indicator, for want of a better name I called “Traffic Lights” to show (user selected) any of 5 methods for interpreting who is in charge. I put an exponential MA in the indicator parameters for generalizing. If the EMA period is set to 1, it obviously gives the initial movement for each interpretation without any averaging or generalising. I will post individually below four self explanatory charts,
then the code. The second and fourth
chart show the master Traffic Light indicator for a HA body size interpretation. I was using an EMA3 on all of the indicators
in the charts. |
|
|
BC User since June 2007
|
|
 |
|
cmacdon 
BullCharts Guru 
Joined: 09 Sep 2012 Location: Brisbane Posts: 236 |
 Post Options Post Options
 Quote Quote  Reply Reply
 Posted: 30 Jul 2014 at 10:57am Posted: 30 Jul 2014 at 10:57am |

|
|
|
BC User since June 2007
|
|
 |
|
cmacdon 
BullCharts Guru 
Joined: 09 Sep 2012 Location: Brisbane Posts: 236 |
 Post Options Post Options
 Quote Quote  Reply Reply
 Posted: 30 Jul 2014 at 10:59am Posted: 30 Jul 2014 at 10:59am |

|
|
|
BC User since June 2007
|
|
 |
|
cmacdon 
BullCharts Guru 
Joined: 09 Sep 2012 Location: Brisbane Posts: 236 |
 Post Options Post Options
 Quote Quote  Reply Reply
 Posted: 30 Jul 2014 at 11:03am Posted: 30 Jul 2014 at 11:03am |

|
|
|
BC User since June 2007
|
|
 |
|
cmacdon 
BullCharts Guru 
Joined: 09 Sep 2012 Location: Brisbane Posts: 236 |
 Post Options Post Options
 Quote Quote  Reply Reply
 Posted: 30 Jul 2014 at 11:06am Posted: 30 Jul 2014 at 11:06am |

|
|
|
BC User since June 2007
|
|
 |
|
cmacdon 
BullCharts Guru 
Joined: 09 Sep 2012 Location: Brisbane Posts: 236 |
 Post Options Post Options
 Quote Quote  Reply Reply
 Posted: 30 Jul 2014 at 11:07am Posted: 30 Jul 2014 at 11:07am |
|
Code is Below {Cmacdon Note: This Traffic Light indicator is
amalgamation of 5 ways to interpret who is in charge of the market}
{Choose} Ch := input("1=Body 2=TW 3=LW
4=Torque 5=HAbody",5,1);
{Exponential MA period} pd := input("MA Time
periods",3,1);
{1=Candle Body interpretation of net Smart
Money. On assumption wicks are downward
tests or upthrust testing within a bar} Body:=(C-O);
{2=Tom Williams basis for identifying a trend
interpretation across tqo bars} TW:=Close-Hist(C,1);
{3=Larry Williams approach to net Smart Money within
a bar} LW:=((C-L)-(H-C));
{4=Torque approach to net Smart Money (see earlier
post for reference to William C Garret Work} Value1a
:= If(H>=Hist(C,1),- (H-L), H-Hist(c,1)-(H-L)); {Price movement representing Selling Vol} Value2
:= If(H>=Hist(C,1),(H-Hist(c,1) + (C-L)), (C-L)) ; {Price movement
representing Buying Vol} Torque:=(Value1a+Value2);
{5=Heikin Ashi Aprroach to Candle Body Size} haClose
:= (O+H+L+C)/4; haOpen
:= (prev + hist(haClose,1))/2;
HAbody:=(haClose-haOpen);
TrafficLight:=(if(ch=1,Body, if(ch=2, TW, if(ch=3,LW, if(ch=4,Torque,HAbody)))));
Greenlight:=Ma(TrafficLight,Pd,Exponential);
[name=Green Traffic Lights1; linestyle=Solid; width=2] [color=Black; name=Greenlight] Greenlight;
[Linestyle=Solid; Color=black;] d:=0; d;
[linestyle=fill; color=Green;]Greenlight; [linestyle=fill; color=RED;]d;
[name=Green Traffic Lights Go; linestyle=bar; width=4] [color=Green;] If(Greenlight>=0,Greenlight,undefined);
[name=Traffic Lights Warning; linestyle=bar; width=4] [color=Orange;] If(Greenlight>=0 AND Greenlight<Hist(Greenlight,1),Greenlight,undefined);
[name=Red Traffic Lights; linestyle=bar; width=4] [color=Red;] If(Greenlight<0,Greenlight,undefined);
[name=Red Traffic Lights Get ready; linestyle=bar; width=4] [color=Lime Green;] If(Greenlight<0 AND Greenlight>Hist(Greenlight,1),Greenlight,undefined); |
|
|
BC User since June 2007
|
|
 |
|
Post Reply 
|
| Forum Jump | Forum Permissions  You cannot post new topics in this forum You cannot reply to topics in this forum You cannot delete your posts in this forum You cannot edit your posts in this forum You cannot create polls in this forum You cannot vote in polls in this forum |