VSA, Wyckoff & Gann Case studies using Bullcharts |
Post Reply 
|
| Author |
 Printable Version Printable Version Delicious Delicious Digg Digg Facebook Facebook Furl Furl Google Boomarks Google Boomarks Google Buzz Google Buzz MySpace MySpace Newsvine Newsvine reddit reddit StumbleUpon Translate StumbleUpon Translate Twitter Twitter Windows Live Windows Live Yahoo Bookmarks Yahoo Bookmarks Topic Search Topic Search  Topic Options Topic Options
|
cmacdon 
BullCharts Guru 
Joined: 09 Sep 2012 Location: Brisbane Posts: 236 |
 Post Options Post Options
 Quote Reply Quote Reply
 Topic: VSA, Wyckoff & Gann Case studies using Bullcharts Topic: VSA, Wyckoff & Gann Case studies using BullchartsPosted: 23 Sep 2012 at 10:06pm |
|
I will do this again as new post went into limbo and disappeared.
In the VSA posts there are various references to sources of material for either Wyckoff or Tom Williams. I thought I would put down 3 case study methods I use with Bullcharts. So I do not lose this post I will attach 3 images seprately then describe the souce of the data at the end of the post so I do not have to keep retyping if this disappears again. Pictures are 1) 1929 Crash on DJIA using VSA on Bullcharts. 2) Whyckoff 1930-1931 Case Study of New York Times from one of his courses on Bullcharts. 3) Gann DJIA Case Study from 45 Years on Wall Street on Bullcharts. |
|
|
BC User since June 2007
|
|
 |
|
|
cmacdon
BullCharts Guru
Joined: 09 Sep 2012 Location: Brisbane Posts: 236 |
Post Options
Quote Reply
Posted: 23 Sep 2012 at 10:06pm |
|
|
|
BC User since June 2007
|
|
|
|
|
cmacdon
BullCharts Guru
Joined: 09 Sep 2012 Location: Brisbane Posts: 236 |
Post Options
Quote Reply
Posted: 23 Sep 2012 at 10:14pm |
|
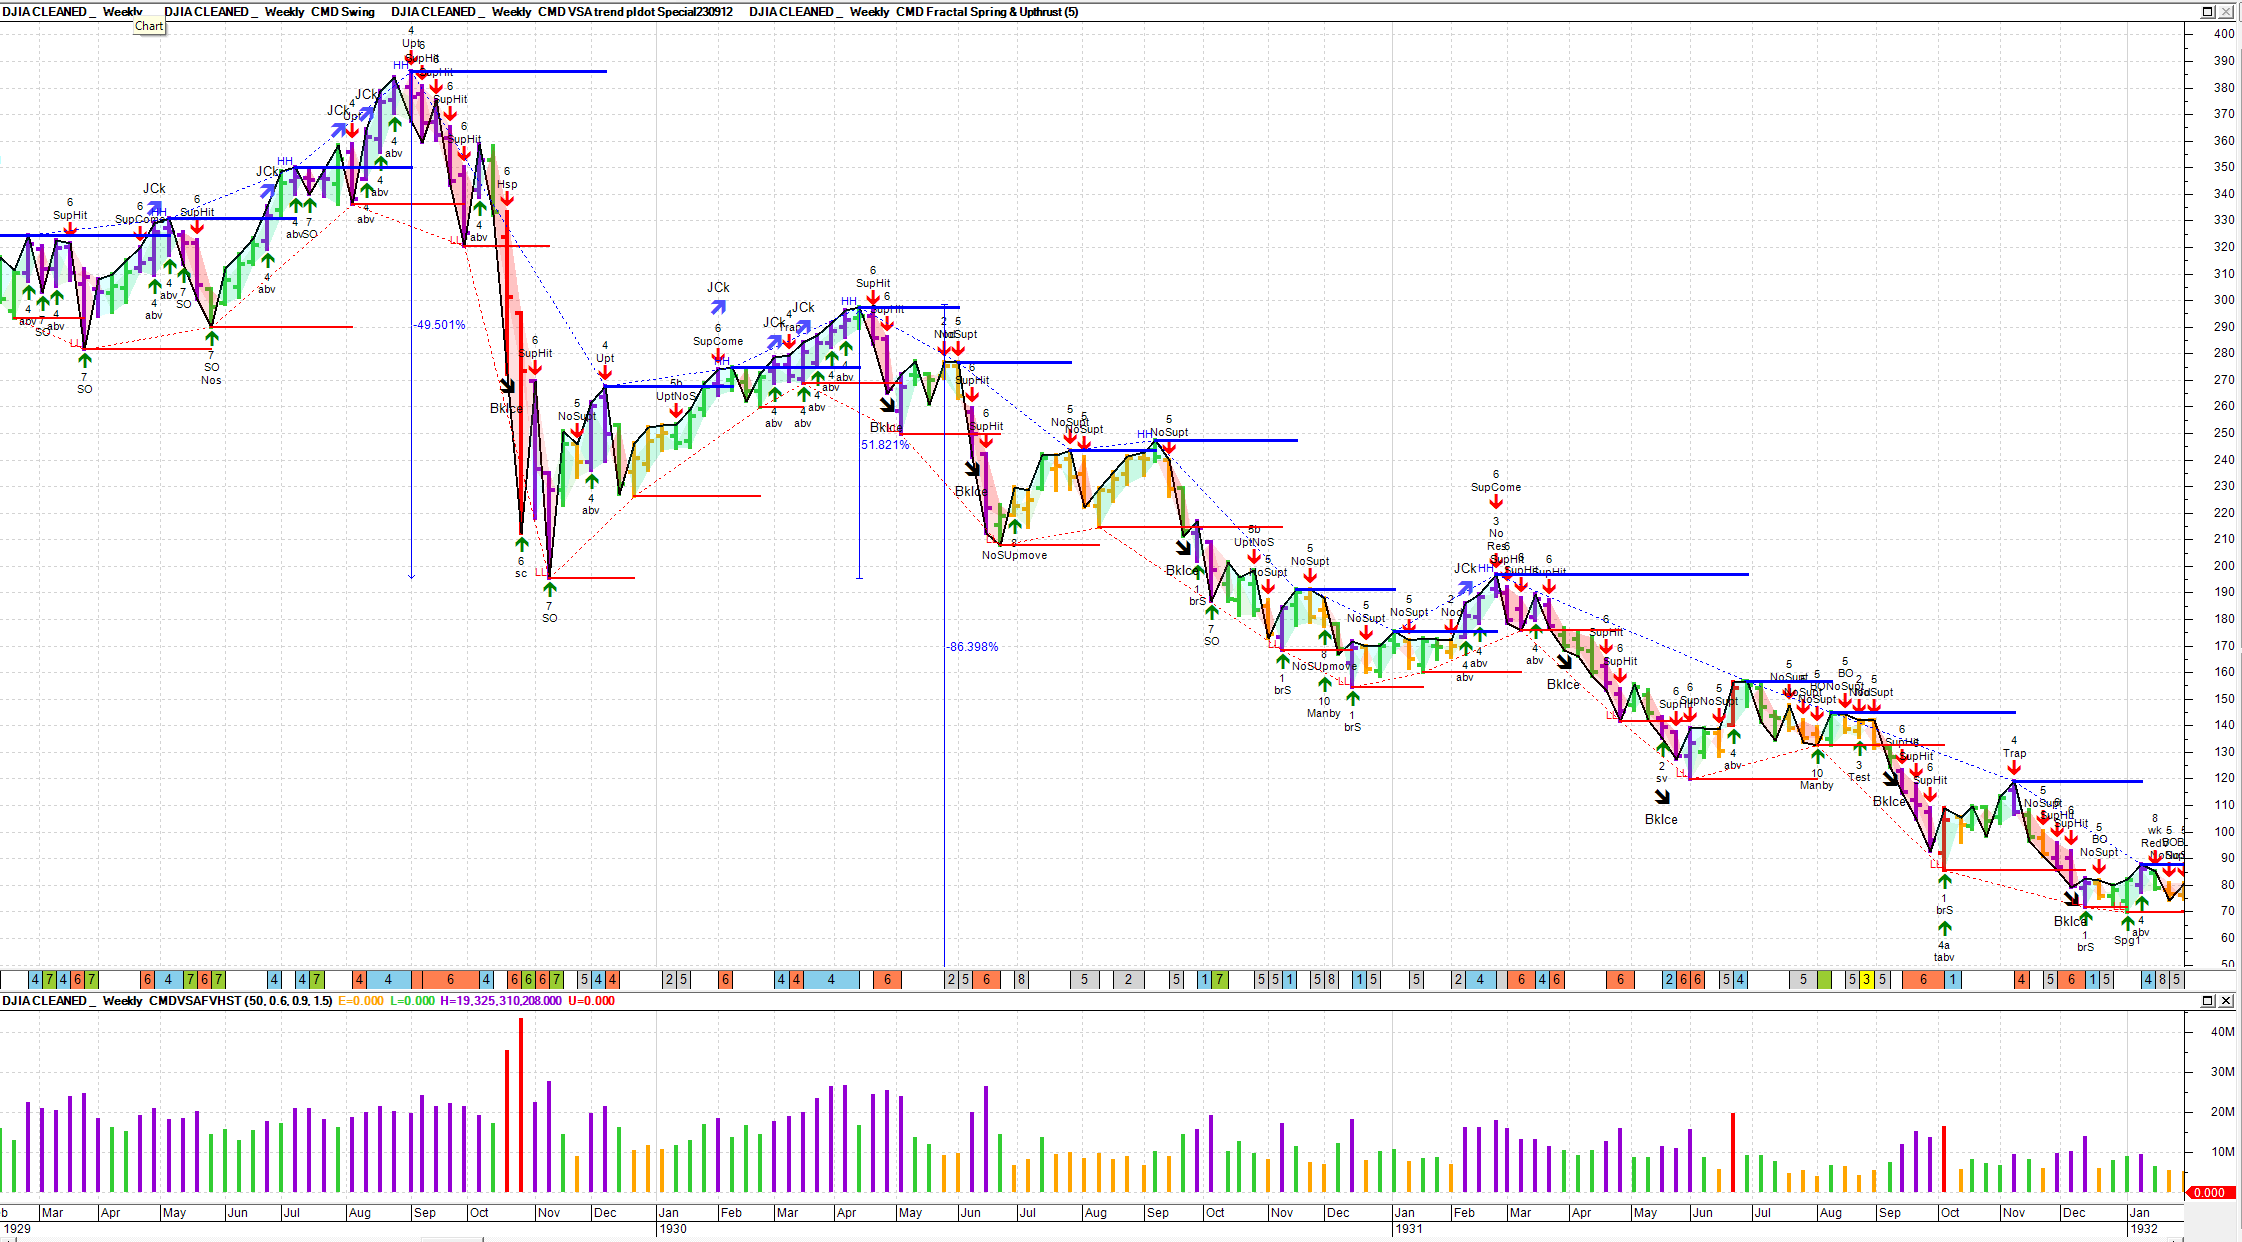
This is VSA indicators applied to DJIA data. DJIA data can be foud on internet going back reasonably accurately to about 1915. Interesting |VSA indicator shows Selling Climax followed by another big shakeout in Oct 1929. Market fellinitially by 50% then rally up from lower base of 52%, then slow decline over next 2 years of 86% approx.
Apart from the VSA indicators, the chart shows I I adapted one of Maximo's Support and resistance inidcators in a previous forum post to try and show Wyckoffs Jumping the Creek and Breaking of Ice, and separate from the VSA inidcators, there is independently calculated Spring and Upthrusts from the resistance and Support levels.
|
|
|
BC User since June 2007
|
|
|
|
|
cmacdon
BullCharts Guru
Joined: 09 Sep 2012 Location: Brisbane Posts: 236 |
Post Options
Quote Reply
Posted: 23 Sep 2012 at 10:23pm |
|
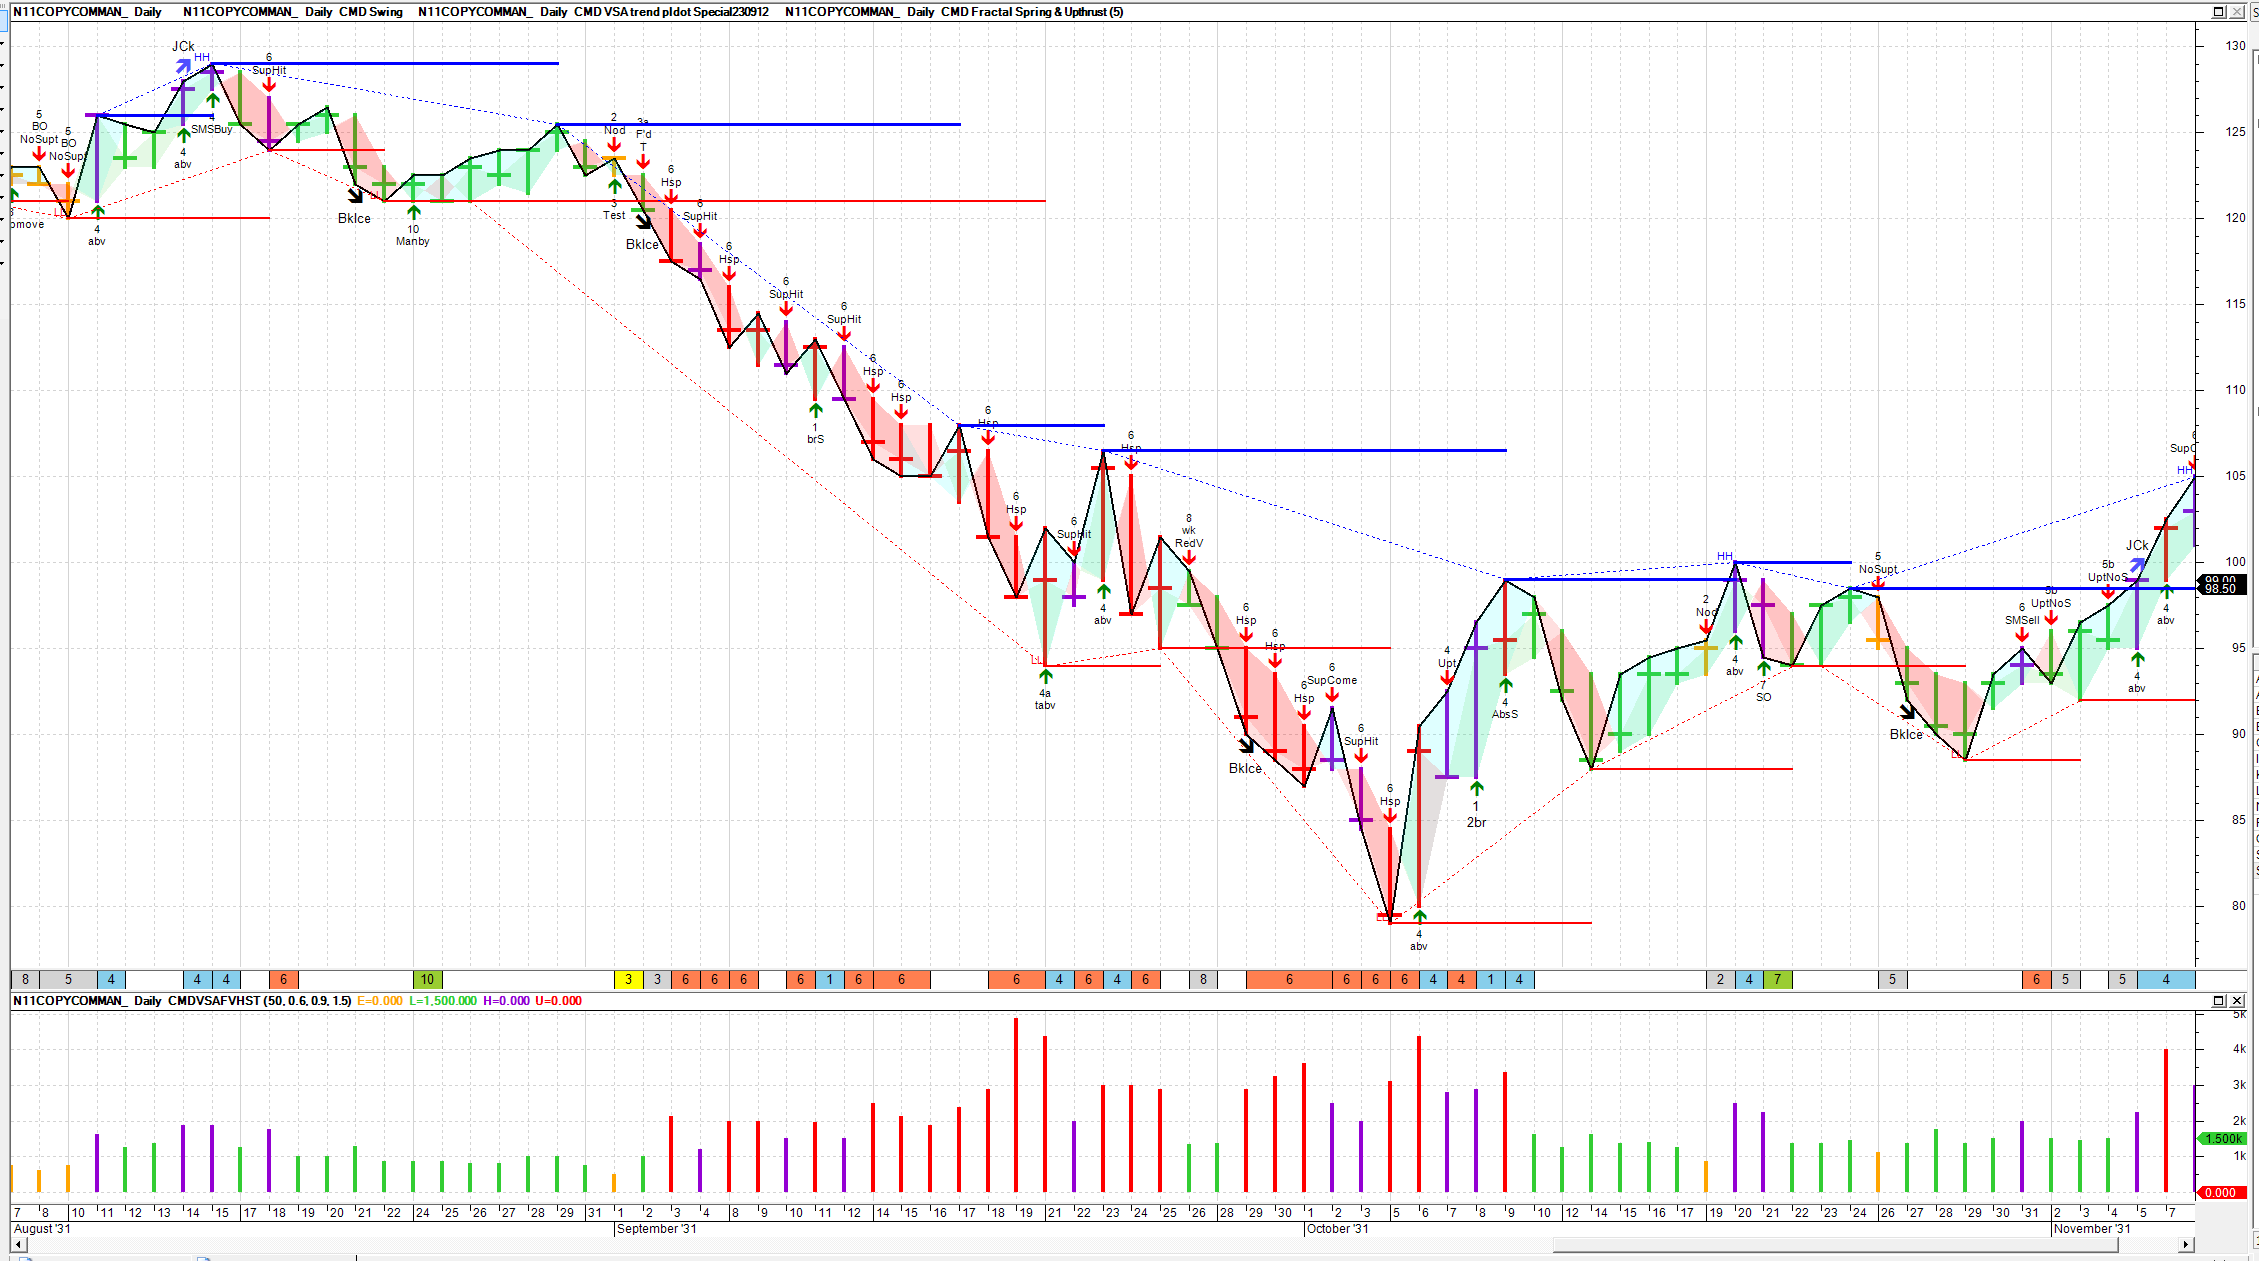
2) Wyckoffs 1930 to 1931 CASE Study of the New York Times index from Section 7M of "The Richard D.Wyckoff Method of Trading and INvesting in Stocks. PDF of the course can be found on internet. Comma separated stock data file obtained from a post in the TradersLaboratory.com Wyckoff Forum, I converted to Metastock using HSQuote. (Note SImilar chart results can be obtained by applying DJIOA datra over same period).
Note Dr Garry Dayton sells two videos analysing this case study and advises that David Weiss (Dayton's mentor) had said the case study had profound effect on David Weiss's understanding of Wyckoff. Once you have data you can anayse any way you want on Bullcharts. I use VSA mainly.
 |
|
|
BC User since June 2007
|
|
|
|
|
cmacdon
BullCharts Guru
Joined: 09 Sep 2012 Location: Brisbane Posts: 236 |
Post Options
Quote Reply
Posted: 23 Sep 2012 at 10:32pm |
|
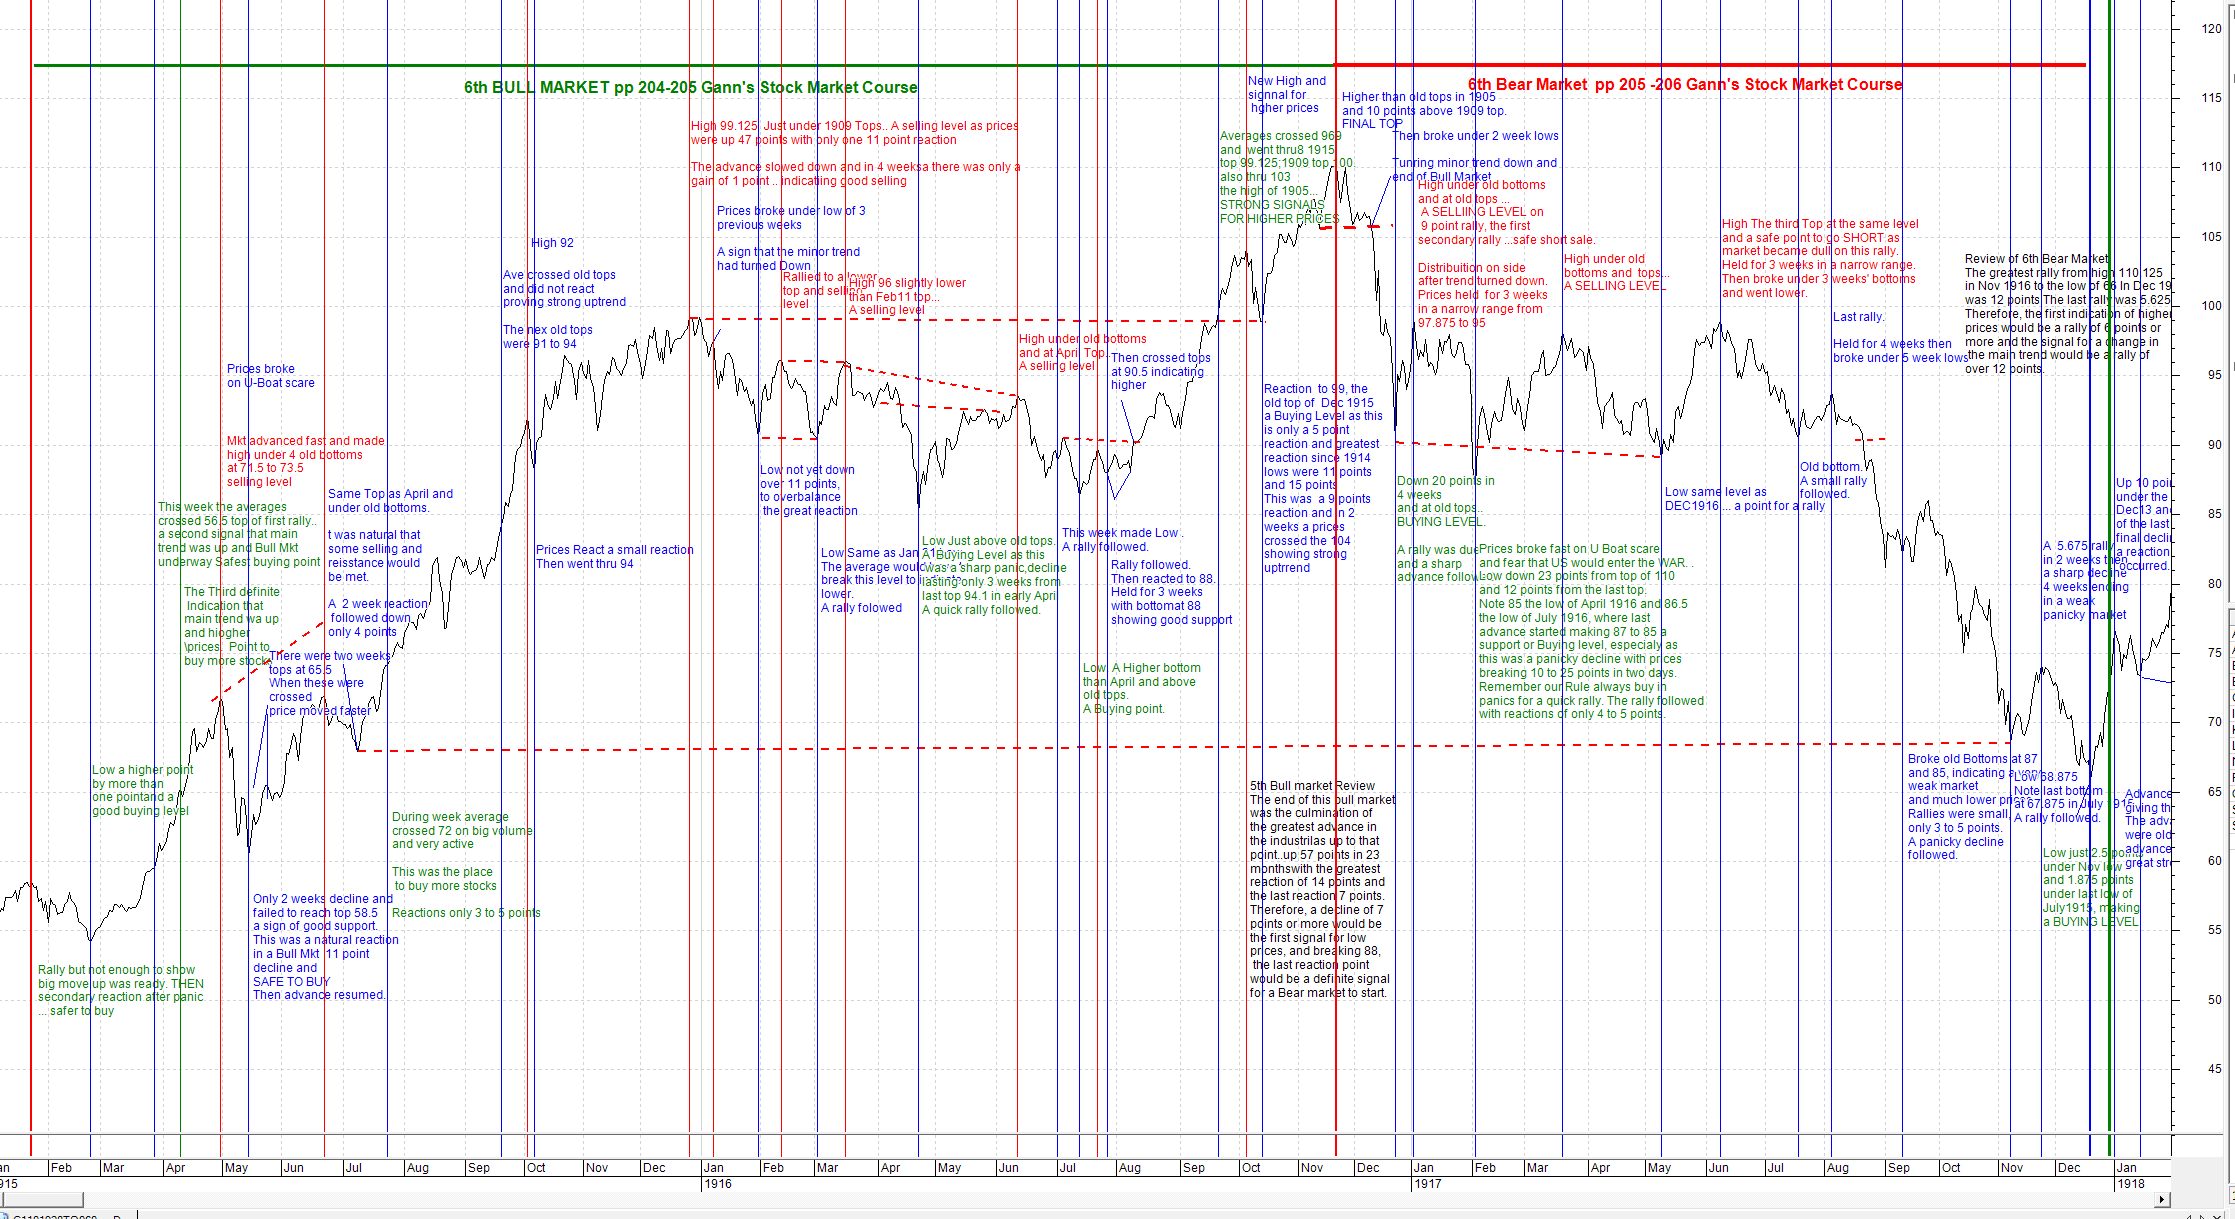
3) Gann Case Study. Gann had very droll way of describing case studies in his books and courses. He provided his analysis of DJIA at various times in 45 Years on Wall Street and his Stock Market Course. I retyped his narrative of the 6th Bull and 6th Bear Campaign from his course in to Bullcharts using the DJIA data for teh periods. Using verticle lines to align the text exactly to the date he refers to and using dotted lines to refer back to the peaks and troughs he says are important for his trading decisions, one can get a better grasp on what he is concluding than you can by merely reading his prose.
|
|
|
BC User since June 2007
|
|
|
|
|
joea
Newbie 
Joined: 15 Nov 2011 Location: Miallo Posts: 19 |
Post Options
Quote Reply
Posted: 24 Sep 2012 at 4:41am |
|
cmacdon
Well you certainly been busy on the weekend. Hopefully you can compile VSA setups to be an advantage to your trading. joea |
|
|
|
|
cmacdon
BullCharts Guru
Joined: 09 Sep 2012 Location: Brisbane Posts: 236 |
Post Options
Quote Reply
Posted: 24 Sep 2012 at 6:40am |
|
Joea
Busy in the past not this wekend. VSA is mainly what happened or is happening. I also use Wavelet, Spectrum analyser and Turbo Cycles on Timing Solutions to assess what might happen
|
|
|
BC User since June 2007
|
|
|
|
|
Post Reply
|
| Forum Jump | Forum Permissions You cannot post new topics in this forum You cannot reply to topics in this forum You cannot delete your posts in this forum You cannot edit your posts in this forum You cannot create polls in this forum You cannot vote in polls in this forum |


