Bear Market Bottom - Fund managers buying |
Post Reply 
|
| Author |
 Printable Version Printable Version Delicious Delicious Digg Digg Facebook Facebook Furl Furl Google Boomarks Google Boomarks Google Buzz Google Buzz MySpace MySpace Newsvine Newsvine reddit reddit StumbleUpon Translate StumbleUpon Translate Twitter Twitter Windows Live Windows Live Yahoo Bookmarks Yahoo Bookmarks Topic Search Topic Search  Topic Options Topic Options
|
rbbrain 
BullCharts Staff 

Joined: 22 Jul 2006 Location: Melbourne Posts: 173 |
 Post Options Post Options
 Quote Reply Quote Reply
 Topic: Bear Market Bottom - Fund managers buying Topic: Bear Market Bottom - Fund managers buyingPosted: 17 Dec 2008 at 1:38pm |
|
Bear Market Bottom — Fund managers buying?
Towards the end of a bear market, the fund and institutional managers start buying up cheap stocks. Question: Is it possible to detect this buying activity? and is this a reliable indicator of a bear market bottomming? If you have different ideas about a bear market bottom, then please post it in another Topic, or if you can't find one, create a New Topic like this one. CAUTION: Any information on this forum is general in nature. Nothing that you read here can be construed as financial advice. Any information here is just for discussion and education. Your own personal financial situation has not been considered. THIS FORUM DOES NOT CONTAIN INVESTMENT ADVICE!! |
|
|
Convenor - Australian BullCharts User Group Brainy's Share Market Toolbox and BullCharts Tips [/CENTER |
|
 |
|
|
rbbrain
BullCharts Staff
Joined: 22 Jul 2006 Location: Melbourne Posts: 173 |
Post Options
Quote Reply
Posted: 17 Dec 2008 at 3:23pm |
|
News today (AFR):-
(1) Russell Investments has surveyed 41 fund managers, and the number who prefer cash has fallen from 50% to 13%. Also, the number who are bullish about the local market is now up to 54%.
(2) Roger Montgomery (Clime Asset Management) is a Buffett-style value manager whose portfolio was 70% cash, but is now down to 40% cash.
BEWARE:- This is not a recommendation, nor investment advice.
|
|
|
Convenor - Australian BullCharts User Group Brainy's Share Market Toolbox and BullCharts Tips [/CENTER |
|
|
|
|
Bana
Regular 

Joined: 02 Jan 2007 Location: Australia Posts: 46 |
Post Options
Quote Reply
Posted: 13 Feb 2009 at 5:50pm |
|
no matter what the surverys say, at the end of the day, the volume bars in conjunction with price will show whats happening.
There is no magic number for volume. Everything is relative. So I use a 50 day EMA on volume to gauge higher or lower volume activity and in relation on previous volume bars. I use semi log scale on volume pane which helps with the relative analysis. Will post some examples later. Edited by Bana - 13 Feb 2009 at 5:51pm |
|
|
|
|
ddddyyyy
Newbie 
Joined: 11 Jun 2009 Posts: 1 |
Post Options
Quote Reply
Posted: 15 Jun 2009 at 11:14am |
|
I agree with rbbrain Edited by rbbrain - 07 Mar 2011 at 1:46pm |
|
|
|
|
cmacdon
BullCharts Guru 
Joined: 09 Sep 2012 Location: Brisbane Posts: 236 |
Post Options
Quote Reply
Posted: 17 Sep 2012 at 9:10am |
|
Just to add my 2 bits. If you study Volume Spread Anaysis (VSA) then, despite my comments about the construction of individaul indicators being being judgemental, in the Bullscript post, one thing it is very good at is indicating on charts at the right edge when market tops and bottoms are approaching and reversing direction based on Signs of weakness relevant Signs of strength. It relies purely on relative strength of volume and relaltive spreads in the price action, and the authors emphasis Whyckoff advice to be wary of the news and annoucements about what "Smart Money" is doing.
|
|
|
BC User since June 2007
|
|
|
|
|
cmacdon
BullCharts Guru
Joined: 09 Sep 2012 Location: Brisbane Posts: 236 |
Post Options
Quote Reply
Posted: 17 Sep 2012 at 10:26am |
|
If any interest I posted a VSA chart under VSA posts in Bullscript Section that shows Some VSA indicators at end of GFC bear market for BHP
|
|
|
BC User since June 2007
|
|
|
|
|
rbbrain
BullCharts Staff
Joined: 22 Jul 2006 Location: Melbourne Posts: 173 |
Post Options
Quote Reply
Posted: 02 May 2020 at 9:59am |
|
With a severe bear market in place in 2020, due to the global
coronavirus pandemic, bear market bottom hunting will be the discussion
topic in the May 2020 User Group meeting/webinar. Any early thoughts on
the topic under this heading of fund managers can be posted here.
|
|
|
Convenor - Australian BullCharts User Group Brainy's Share Market Toolbox and BullCharts Tips [/CENTER |
|
|
|
|
cmacdon
BullCharts Guru
Joined: 09 Sep 2012 Location: Brisbane Posts: 236 |
Post Options
Quote Reply
Posted: 02 May 2020 at 1:45pm |
|
My study of wave price vibrations suggest technical indicators will be of no help to identify a market bottom until at least 3 to 7 daily bars have expired after a market has turned around. Anyone who has studied JM Hurst will recall that he suggested forseeable fundamental events influencing investor thinking about industry groups and specific issues account for 75% of the price motion of stocks or the trends. That seems to hold true for Covid-19 as it was only in March 2020 when the market panicked after understanding the full implication of the pandemic. Hurst suggested 23% of price motion is oscillatory in nature and semi-predictable -by indicators like his centered moving averages/envelopes). The remaining 2% of price movement is random. An old but reasonable major trend reversal signal for a fast-moving stock was Gann's Rule of Three, which is looking for three sequential higher or lower closes in the opposite direction to a main trend as a reversal signal. In the image below, such a bar has not arrived yet, so I assume in the bigger picture the trend is still down for the time being. (There seems to be a problem uploading images to this post. So I will try again later). |
|
|
BC User since June 2007
|
|
|
|
|
cmacdon
BullCharts Guru
Joined: 09 Sep 2012 Location: Brisbane Posts: 236 |
Post Options
Quote Reply
Posted: 05 May 2020 at 7:12am |
|
Image problem was fixed
The first chart below is a basic version of Gann's Rule of Three from his Wall Street Stock Selector book. Gann provided the data in the book which I converted to Excel and then Metastock format so I could be read by Bullcharts. Gann suggested he sold the Rule of Three to other traders who wanted to know his secret for over $1,000 before 1930. As it is a time and price method for fast-moving stocks, I suspect it was a practical application of his Law of Vibration from 1909. The Rule of Three is looking for three sequential closes in the opposite direction to the main fast-oving trend. The rule does not work so well with slow moving trends. 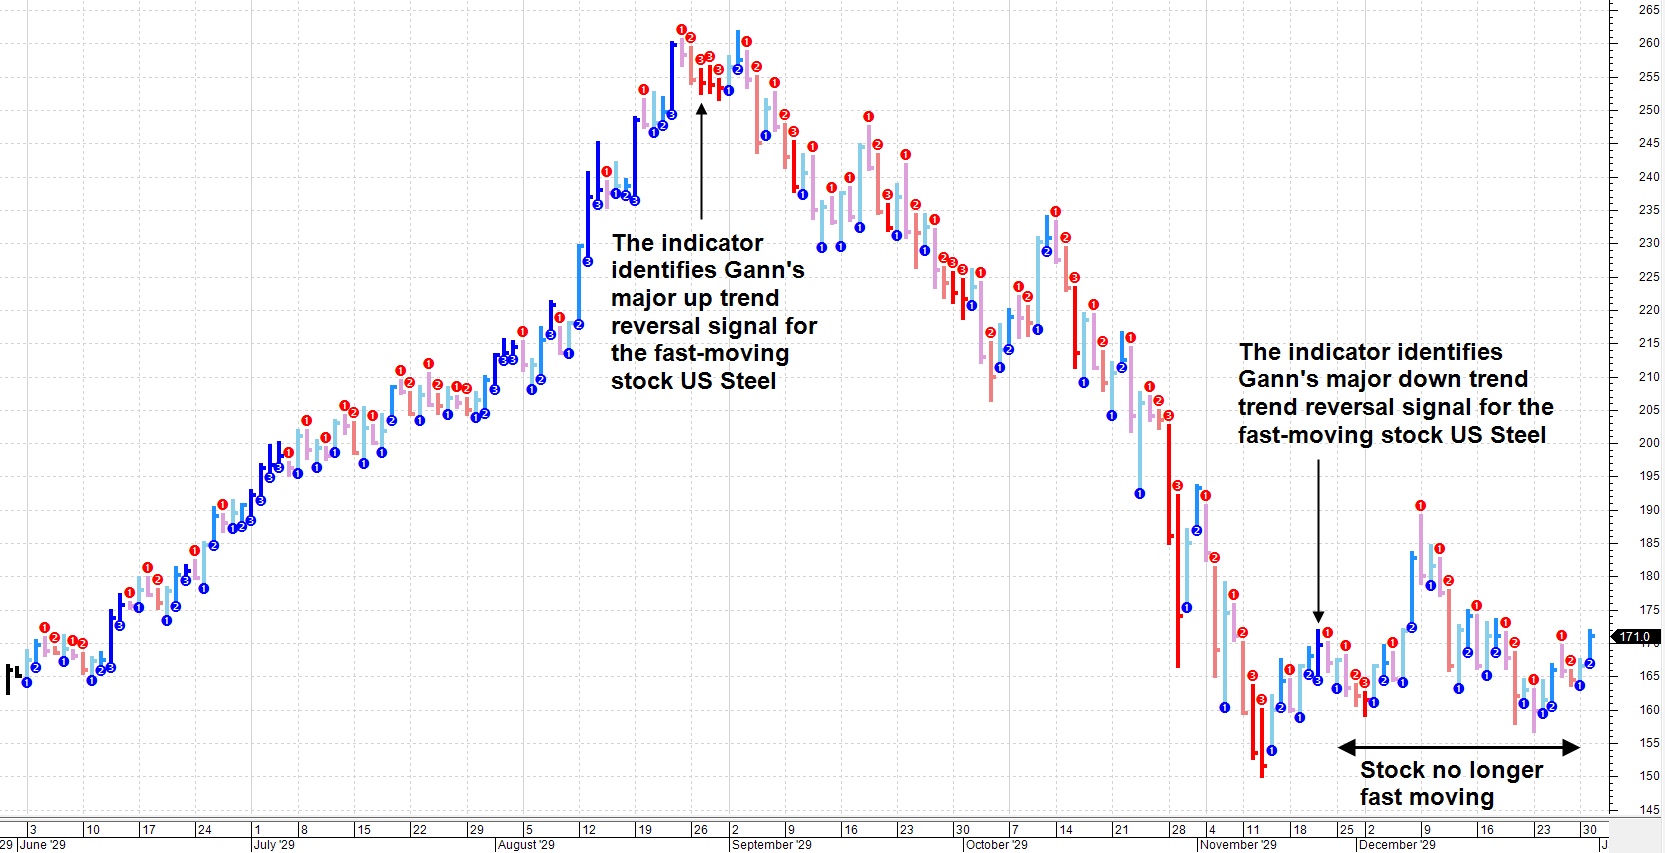 |
|
|
BC User since June 2007
|
|
|
|
|
maximo
BullCharts Guru

Joined: 02 Sep 2006 Location: Australia Posts: 232 |
Post Options
Quote Reply
Posted: 06 May 2020 at 4:05am |
|
A Slow/Fast-moving trend can be identified using ADX. Good study. |
|
|
|
|
Post Reply
|
| Forum Jump | Forum Permissions You cannot post new topics in this forum You cannot reply to topics in this forum You cannot delete your posts in this forum You cannot edit your posts in this forum You cannot create polls in this forum You cannot vote in polls in this forum |


