Proposed Book
Printed From: BullCharts Forum
Category: BullCharts
Forum Name: BullScript
Forum Discription: Technical discussion related specifically to the BullScript programming language.
URL: http://www.bullcharts.com.au/forum/forum_posts.asp?TID=994
Printed Date: 20 Apr 2024 at 11:56am
Software Version: Web Wiz Forums 9.69 - http://www.webwizforums.com
Topic: Proposed Book
Posted By: cmacdon
Subject: Proposed Book
Date Posted: 01 Sep 2015 at 11:52am
|
In reply to previous post responding about Weis Waves I advised I am now writing a book based on understanding the approaches of a number of the Trading Masters from the last 115 years and building on their approaches with new supply and demand indicators. The book will come out shortly. The new indicators go well beyond my original indicator settings above as I can calculate the gross buying and gross selling volume within bars and across bars so it is very much like understanding a micro economic supply and demand on up waves and down waves. Properly understood and measured supply and demand does drive prices higher or lower. In my opinion, is a much better approach than looking purely at Total Volume or average volume waves. The indicators can be used in conjunction with other techniques that in the past only relied on time and price dimensions e.g. Hurst Cycles, Elliott Wave, and Merrill Filtered Waves etc. Below I show a few of the new indicators on charts. The historical context for the development of the indicators is covered in the book but not below. ------------- BC User since June 2007 |
Replies:
Posted By: cmacdon
Date Posted: 01 Sep 2015 at 12:05pm
|
Top Left chart shows the 4 options for what I call a Forensic supply and demand indicator that has a nominated start date and then shows the average supply and demand or the total supply and demand or the marginal supply and demand, or the netted off marginal supply and demand from the start date. Top right chart shows analyses of three ranges using a Gross buying and selling volume wave indicator and a netted off buying and selling volume wave indicator. The text relates to various Wyckoff type marker/analyses from the chart patterns. Bottom left is using the Forensic supply and demand indicator to analyse a famous Elliott Wave expert's analysis of the DJIA and calculating where the end of a EW should end based on micro economic supply and demand. (EW analysis normally does not involve volume in the calculations). Bottom right is a chart where the price bars are coloured based on supply and demand using supply and demand benchmarked statistics obtained in the past prior to the commencement of the bars on this chart. So history repeats based on a supply and demand analysis of the past. . 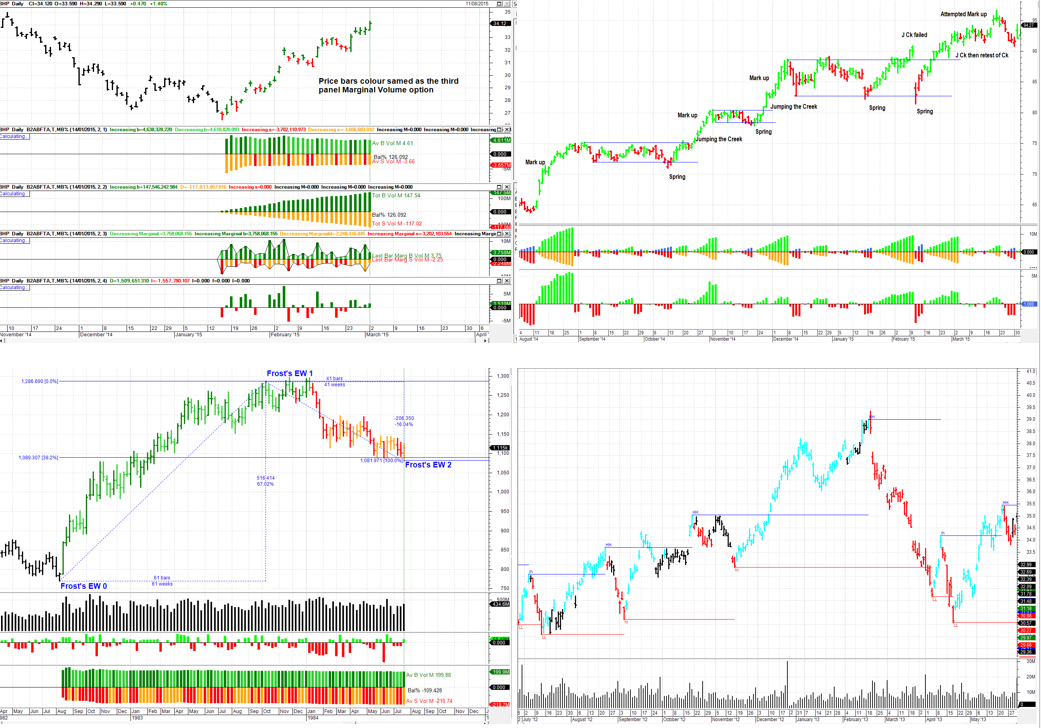 ------------- BC User since June 2007 |
Posted By: cmacdon
Date Posted: 01 Sep 2015 at 12:16pm
|
Top left chart is showing a Smart Money Detector indicator with a bar by bar setting to analyse supply and demand on each bar. Bar by bar supply and demand is too hard to make much sense. The Top right chart is exactly the same indicator but using a higher MA setting for calculating the supply and demand across bars - now you can more clearly see where the buying and selling energies are moving the markets up or down. Bottom left is where I had been using the Smart Money Detector to monitor the GSPC over last year or so. It is relatively clear where the indicator is showing Smart Money activity and where distribution has been occurring. Bottom Right is where I updated the indicator and setting to have a look at the mini crash last week. You can see the last bout of good buying volume appeared to end some months back and thereafter the bars are coloured orange or red indicating net selling was in charge, so perhaps suggesting one should not have been long in the market pre the mini crash 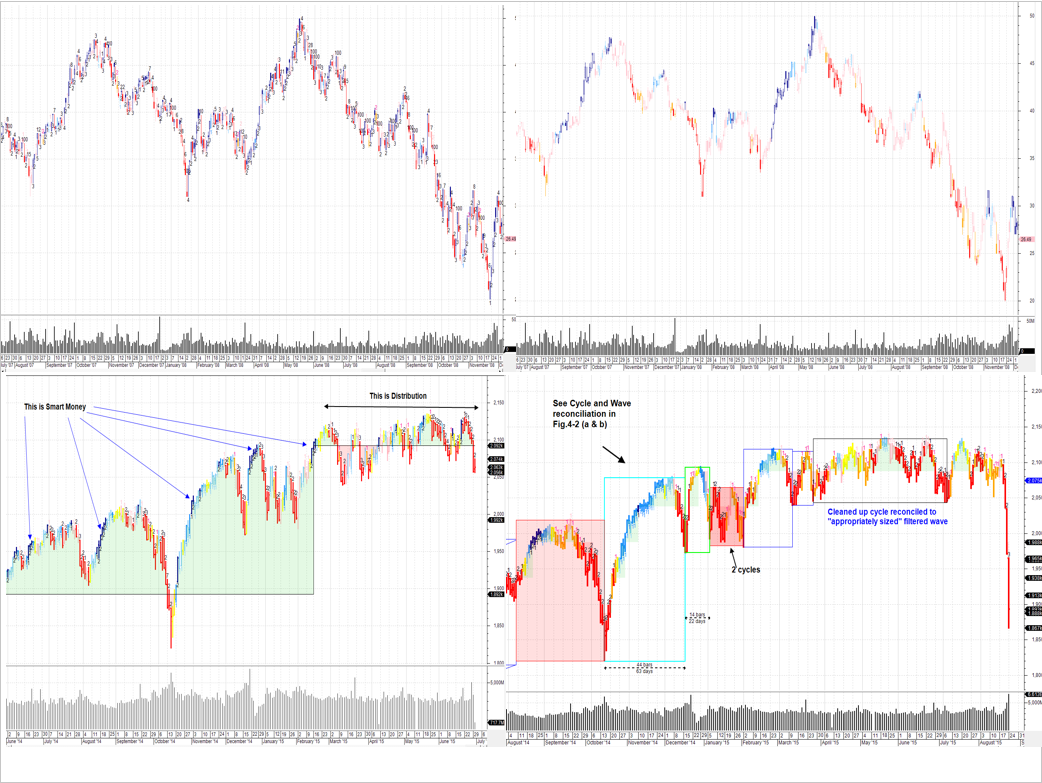 ------------- BC User since June 2007 |
Posted By: cmacdon
Date Posted: 01 Sep 2015 at 12:26pm
|
Top left chart is a Hurst envelope cyclical analysis. Hurst Cycles do not usually involve volume analysis. Bottom two panel indicators show the buying and selling volume waves corresponding to the cyclical envelope analysis. Top right chart is a Wave indicator showing the collection of supply and demand and other statistical information for the previous wave legs. The indicator can also collect the averaged statistics sampled from the last 5 to 8 waves. The book is interspersed with various interesting historical chart analysis. Bottom left is Gann's famous May Soybean chart that involved astrological planetary lines and various confusing angles in the Master's analysis. Bottom Right is a wave indicator applied to the buying and selling activity on the May Soy Bean chart. In this case the include volume option was tuned off as but not volume was not analysed in Gann's chart and the volume data for the chart period was not available. The indicator option to exclude volume still simplifies the analysis of what is otherwise a messy chart to try and understand. 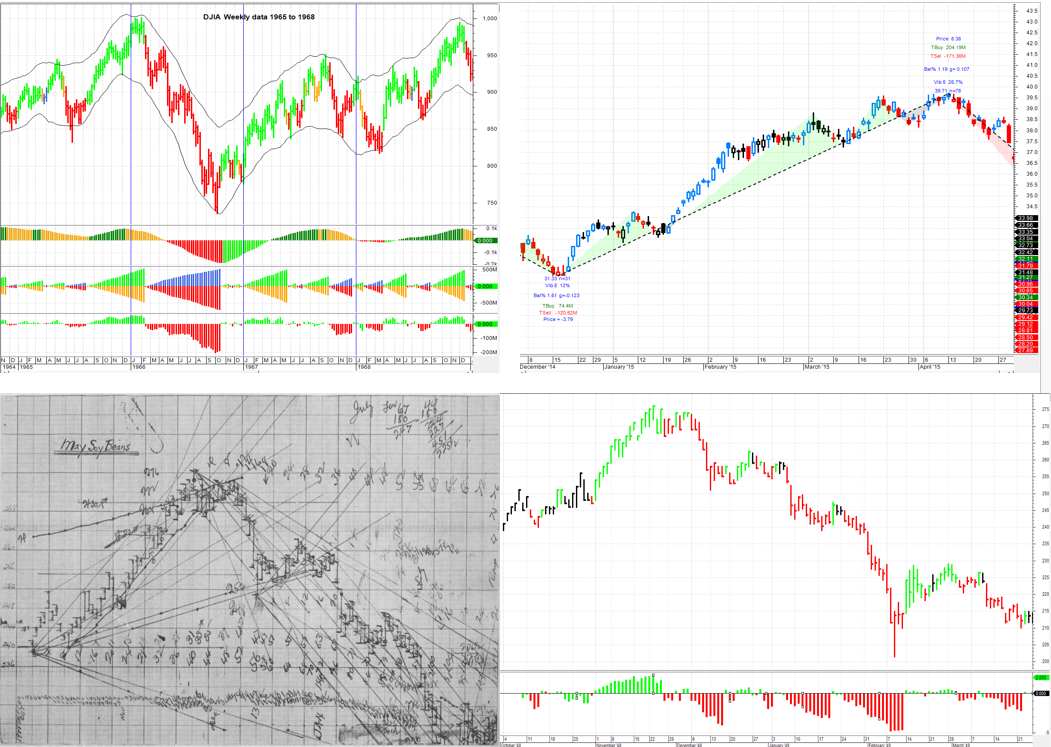 ------------- BC User since June 2007 |
Posted By: cmacdon
Date Posted: 01 Sep 2015 at 12:30pm
|
Single chart just showing how two dimensional price and time data can confuse the understanding of price action but when the real third dimension supply and demand is synchronised with Time and price the chart is more informative. The indicator picks up the 59 trading day and harmonics thereof for the stock 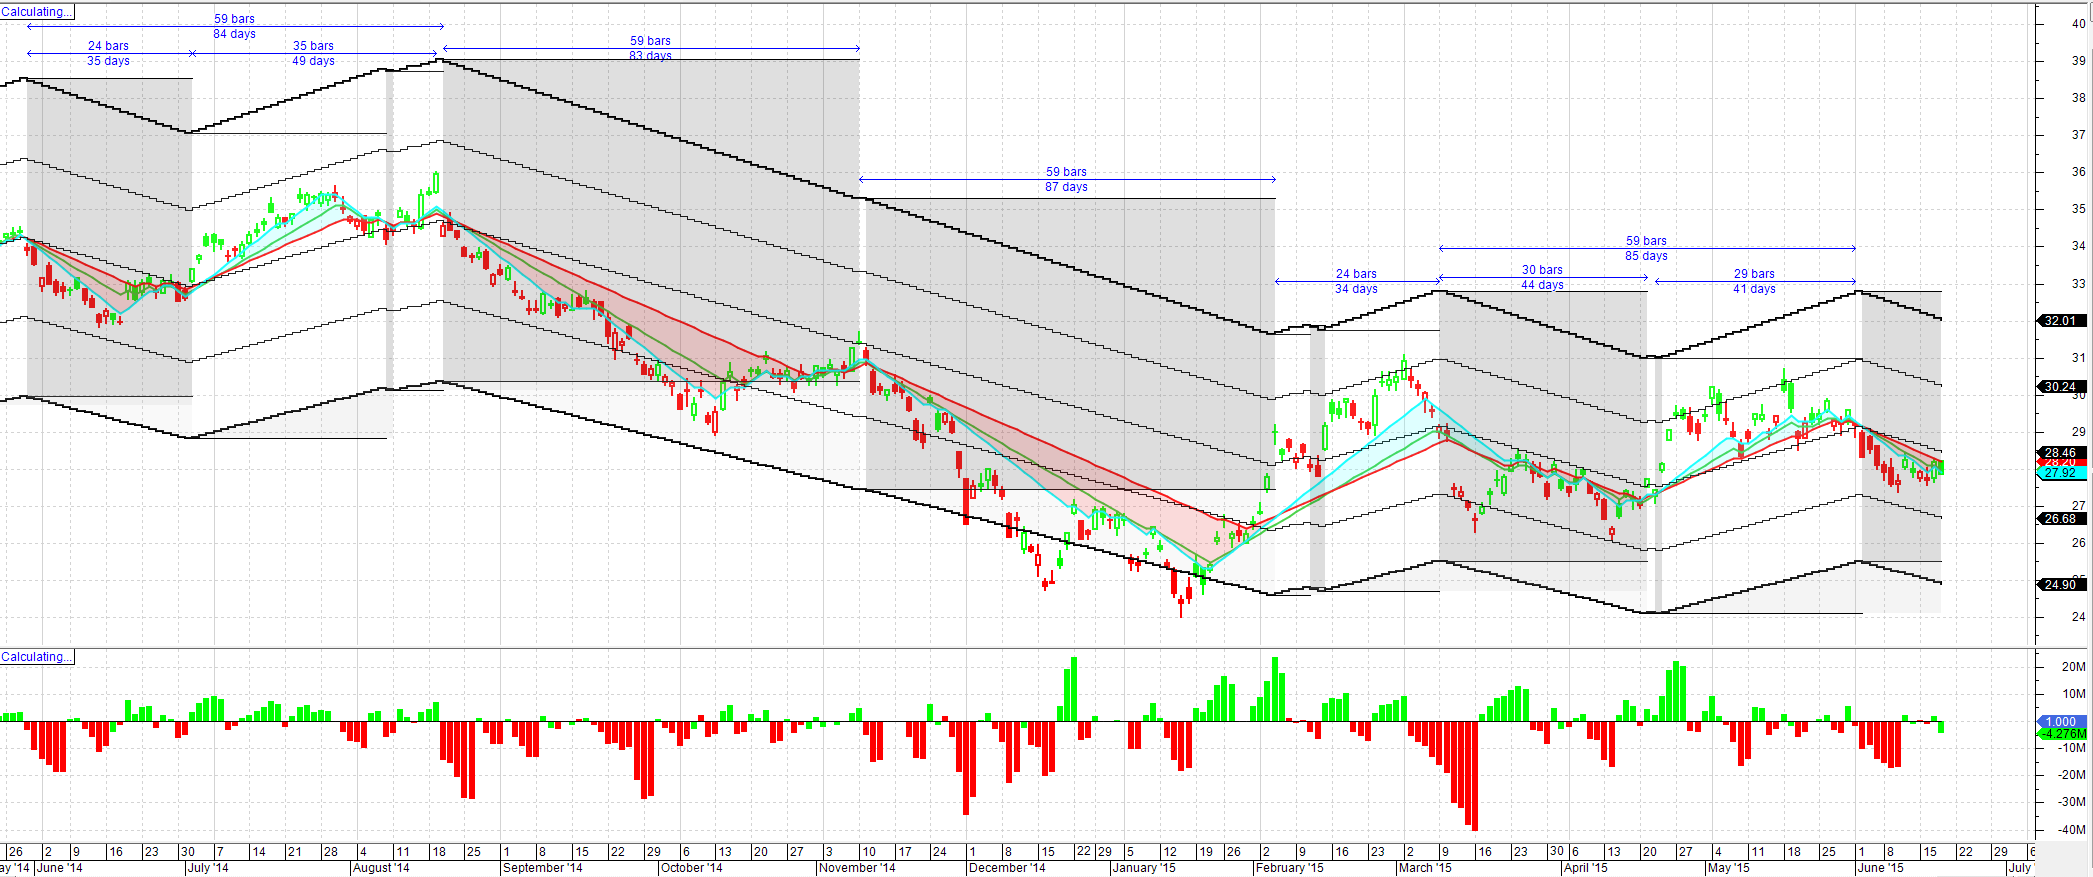 ------------- BC User since June 2007 |
Posted By: cmacdon
Date Posted: 08 May 2018 at 9:51pm
|
Dear All I had a personal message yesterday and a private message today asking when my book was coming out. I apologised yesterday as it has taken 4 years to write instead of my original estimate of 4 months. It shows how much you do not know when you are forced to test things out. My original reply to this forum disappeared so I converted my copy of the contents page will post it as a separate post hopefully that will work. Also, a draft cover will be a separate post. If I have missed something significant in the contents let me know and I will try to address it before I finally sign off. I hope to finish editing and will send it off to the printers after I read a hard copy next week. Regards Charles ------------- BC User since June 2007 |
Posted By: cmacdon
Date Posted: 08 May 2018 at 9:52pm
 ------------- BC User since June 2007 |
Posted By: cmacdon
Date Posted: 08 May 2018 at 10:05pm
|
------------- BC User since June 2007 |
Posted By: cmacdon
Date Posted: 08 May 2018 at 10:08pm
|
Contents Who Am I, and Why This Book was Written 1 My Background 2 The Trading Masters Mind Map 7 1 Vibrations, Oscillations, Periodicity, Waves, and Angles 9 Some Interpretations of Gann’s Law of Vibration 10 Using the Averages as a Trend Indicator 12 Periodicity 14 There Was a Single US Stock Market and Several US Commodity Markets 16 Introduction to Gann’s Master Time Factor 17 Gann’s Quick Angle Method 18 Gann’s Use of Geometrical Angles 18 Gann Setting Up a “Money Value” Angle 20 Jensen’s Use of Angles 21 Richard Ney’s Use of Angles 22 The Law of Action and Reaction 23 Andrew’s Median Line Identification of Price Action and Reaction 24 Merrill’s Filtered Waves 25 Garrett Adapting All Three of Newton’s Laws of Motion 26 Vibrations and Angles – A Summary 26 2 Latent or Hidden Governing Variables for Understanding Financial Markets 28 Natural Laws for Understanding Financial Markets 28 Types of Astro Approaches Applied to Understanding Financial Markets 29 Positions Around the Signs of the Zodiac 30 Gann’s Conversion of Chart Prices to Degrees of the Zodiac 31 Gann’s Averaging of Planet Longitudes 31 Gann’s May Soybean Chart 32 Jensen’s Use of Astrology 33 Bayer’s Use of Astrology 34 The Bible Connection to Astrology 35 Bayer’s Strange “Egg of Columbus” 36 McWhirter’s Use of Astrology 37 Long’s Use of Astrology 38 LCdr. William Use of Astrology 38 3 Sacred Geometry, Fibonacci, Elliott Waves, and Space Levels 39 Dunnigan’s Summary of Natural Laws 39 Space Measurements 40 The “At Least 3/8 Retracement Rule” 41 The Predictive Power of the “At Least 3/8 Retracement” Rule 42 Gnomic Growth 43 R.N. Elliott’s Wave Principle and Natural Law 44 Elliott Wave Analysis Ignores Volume 44 The “Orthodox View” for the End of Elliott Waves 46 The Timing Weakness in Elliott Wave Forecasting 48 Miner’s Dynamic Trading 49 The Proposed Link Between Natures Law, Waves and Cycles 49 Casey’s Wavelet Analysis 50 4 Fundamentals, Market Conditions, Time, and Time Cycles 52 Time as a Fundamental Variable 52 Four Market Phases 52 Interpretations of Bull and Bear Campaigns 54 Gann Following Bull and Bear Campaigns 54 Gann’s Interpretation of the Four Sections to a Bull Campaign 56 Gann’s Interpretation of History Repeating in Bull and Bear Campaigns 58 Conditions Compared to Fundamentals 61 Time Cycles for Stocks as Distinct from Commodities 63 The Possible Link between Gann’s Law of Vibrations and Time Cycles 64 Gann’s Mysterious MTF 65 Gann’s 1929 Forecast 65 Dewey and Dakin’s Cycles Analysis 66 Puetz’s Cycles Analysis 68 Hurst’s Cycles Analysis 68 5 Other Perspectives of Price Structure 71 How Dow Theory Developed 71 A Master Getting into Trouble Using Dow Theory 72 A Valiant but Failed Attempt to Talk Up Dow Theory as a Forecasting Approach 74 Dull Periods Indicating the Buildup of a Cause 76 Forecasting Breakouts from Dull Periods or Ranges 77 Volatility as an Effect 77 Wyckoff’s Idealization of a Bottoming Range where Accumulation is Occurring 77 Selecting which Markets to Trade 80 Large Operators Who Went Broke, and the Implications for Manipulation 80 6 Relative Total Volume, Supply & Demand, and Manipulation 82 Wyckoff’s Tape Reading 83 Gann’s Tape Reading 85 Standard Scaled Chart Paper 86 Neill’s Tape Reading 86 Neill’s Interpretation of Volume 87 Neill’s General Principles for Understanding Volume 88 Wyckoff’s Three Laws for Understanding the US Stock Market 88 A Natural Law Interpretation as to How Volume Affects Prices, and Manipulation 90 Why was Wyckoff not Fooled by Gann’s Talk of a Law of Vibration 91 The Penny Drops 91 Manipulation 95 The Process of Legal Manipulation 96 The Art of Legal Manipulation 97 Identifying Manipulation, if it Exists 98 The Importance of Volume and Supply & Demand When Monitoring a Forecast 99 What Happened to the Discussion of Volume in Gann’s Later Writings? 100 Illegal Manipulation 100 Bar by Bar Chart Reading Including the Principles Underlying VSA 102 Ord’s Average Volume Waves, and Weis’s Total Volume Waves 104 Garrett’s Use of Volume to Identify Cycles 105 7 Viewing Perspectives 108 The Two Paradigms for Understanding the Financial Markets Natural Law or Manipulation 108 Dewey and Dakin’s Argument about Perceiving Cause and Effect 108 The Third, or is it the Fourth Dimension for Understanding a Financial Market? 110 How the Trading Masters Perceived Cause and Effect 111 8 Developing a Traditional Knowledge Bar by Bar Chart Reading Indicator 113 Lessons from a Failed Attempt at Capturing the Expertise of Trading Masters 114 Consistency Problems with Coding What Experts Say 116 Avoid Exception Rules 117 Coloring the Relative Total Volume Bars 118 Use Flexible Perspectives-A SOW May End up as SOS or Vice Versa 118 Avoid Using Hindsight 119 The Elegant Bar by Bar Indicator 119 Coding One’s Own Bar by Bar Understanding of a Financial Market 120 Subtleties of Light (or Lite) Demand 121 Subtleties of Indices and Large Cap Stocks Compared to Small Cap Stocks 122 Defining Turning Points that Identify Market Structure 122 Reading a Market Top 123 The Buying Climax 124 Avoid Trying To Be Too Specific When Defining Price Vibrations 127 Gartley’s Chart of The New York Times 50 Stock Averages 1911 to 1938 129 Identifying Bar by Bar Market Structure Using the DJIA Weekly 1911 to 1938 131 A Quick Lighter-Volume Market Trend Assessment 132 An Assessment of an Uptrend Where Distribution was Occurring 133 Does the Bar by Bar and Market Structure Indicator Work? 135 Case Study-A 1914 Cold Case 136 Case Study-A Post Mortem of Hamilton’s announcements pre and during the 1929 Crash 141 Wyckoff’s Daily Chart of the NYT50 for the Period Dec 1930 to Nov 1931 142 Bar by Bar Indicator-A Comparison to Wyckoff’s 1932 Chart Reading Logic 143 Case Study-The 1987 Stock Market Crash 145 Case Study–A 1998 Bottoming Range with a Selling Climax and a Shakeout 148 Contemporary Events in 2016-the Shock Brexit, and the US Election, Results 150 Bar by Bar Review of the GSPC500 151 9 Deriving the New Way-The 6 Paths Time & Price and Buying & Selling Volume Formula 153 Keely’s Concept of Vibrations and Oscillations 153 Garrett’s Original Torque Analysis Formula 155 Torque Analysis Allocation of the Buying and Selling Volume Components 157 The Amended 6 Paths Gross Supply & Demand Vibration Formula 158 Reconciliation of the Six Price Paths Price Vibration Formula 159 Derivation of the Accumulated Total, Average, and the Marginal, Buying and Selling, Volume 161 Interpreting the Amount of Supply & Demand Effort or Buyer and Seller Behaviors 161 The Gross, Buying and Selling, Volume Within Natural Waves 162 The Net, Buying and Selling, Volume Within Natural Waves 163 Reconciling Gross and Net, Buying and Selling, Volume Within Natural Waves 164 Interpreting the Marginal Change in Supply & Demand Within Trends, or Any Chart Pattern 167 A Review of Some Historical Charts 171 Case Study Understanding Supply & Demand Leading to the 1929 Crash 171 Case Study Understanding Supply & Demand during the Great Depression 172 Supply & Demand, or Cause and Effect, in a Modern Market 173 10 The 6 Paths Measurements of the Forces of Supply & Demand 178 The Garrett Bal% Statistic 178 The SM Bal% Measurement of the Force of Supply or Demand 179 The SM Bal% Pulse Indicator 179 The Cause of Cyclical Price Action, and the Snake to Serpent Indicator 182 Further Examples of Measuring the Forces of Supply & Demand 184 Identifying the Four Market Stages from a Supply & Demand Perspective 188 The Accumulating SM Bal% Indicator 189 The “Appropriate Sizing” Technique to Make Microeconomic Supply & Demand Sense 189 Another Example, Identifying, “Appropriately Sized” Filtered Waves 192 Periodic Recalculations of the Accumulating SM Bal% for Monitoring a Market 194 The 6 Paths Candlesticks and the SM Bal% Forces of Supply & Demand 197 The 6 Paths H, L & C Bars and the SM Bal% Forces of Supply & Demand 200 11 Measuring, Stock, Money Value, and Equilibrium Price Vibrations 201 Understand Market Conditions Before Sampling Price Vibration Measurements 203 Stock Vibrations and Wave Characteristics 204 Working out Geometrical Angles from Sampled Vibrations 205 Obtaining Historical Stock Vibrations from a Relevant Stage Analysis 207 Using the Snake to Serpent Indicator to Clarify Market Stages 208 Extracting Historical Stock Vibrations using Radius Vectors 210 A Gann Mini-World Vibration Indicator 212 Two False Trading Starts When Coming Out of a New Stage 1 214 Introducing Equilibrium Price Vibrations for Longer-Term Forecasting 215 The 6 Paths Annualized Money Value Equilibrium Rate of Return Indicator 216 The 6 Paths Vibration Tracker Indicator 216 12 Volatility is an Effect, not a Cause of Price Action 220 Case Study 1-Supply & Demand as the Underlying Cause of Volatility 220 Case Study 2- Supply & Demand as the Underlying Cause of Volatility 221 13 Single Wave Time & Price Vibration Forecasts, and Wavelet Forecasts 225 Extracting Time & Price Wave Vibrations from a Previous Stage 2 Market Phase 225 Traditional Geometrical Angle Forecasting using Averaged Stock Vibrations 226 A Separate Forecasting Reality 230 Sampling Changing Wave Characteristics and Automated Forecasting Squares 231 Single Wave Forecasting Practice – The Basics 234 Study the Historical Causes, and Forecast Future Likely Effects 242 A Forecast Within a Forecast Indicator 243 The Next Down Wave Forecast 246 Wavelet Pattern Forecasting 247 14 Forensic and Periodic Market Analyzes 250 Forensic Analysis of Supply & Demand Toolkits 250 Periodic Recalculations of a Forensic Analysis of Supply & Demand 252 Case Study-Distinguishing Cycles Versus Trends 256 15 Analyzing Dull Markets Where the Big Money is to be Made 264 Case Study Analyzing Three Quite Different Narrow Trading Ranges 265 The First Dull Period 266 The Second Dull Period 268 The Third Dull Period 271 Using Periodic Recalculation Indicators 274 Case study-A 1948 Line Pattern on the DJIA 275 Case Study-A David Weis Chart Reading Skills Test 281 Case Study-A Difficult Trading Range to Analyze 286 16 Measuring Planetary Vibrations, and Planetary Rhythms in the Stock Market 292 Planets Ingressing and Passing Through the Signs of the Zodiac 292 A Gann Astro Perspective 293 Other Astro Perspectives for Soybeans 295 The New “Quick Heliocentric Planet Trading Day Vibration” Calculations 297 The Gann Mini-World Forecasting Indicator Using Planetary Vibrations 300 Adapting Gann’s Concept of Averaging Planetary Vibrations 301 A Trading Experiment relating to Etheric Vibrations 302 Trading Lunations 304 A Trading Experiment relating to a Supermoon Event 305 17 Self-Adapting Angles Leading to the Third Dimension 307 Comparing Self-Adapting Angles to Historically Measured Angles? 308 Self-Adapting Angle Indicator Using a Planetary Longitude Vibration 314 Matching an Averaged Stock Vibration to a Planet Longitude Vibration 315 The Third-Dimension Indicator Perspective 316 18 Market Structure Based on the Forces of Supply & Demand 320 Time & Price Based Market Structure 320 Supply & Demand Based Market Structure 321 The SM Bal% Spike Indicator 321 Further Examples of the SM Bal% Spike Indicator 324 A 6 Paths Supply & Demand Interpretation of Wyckoff’s Three Important Laws 328 The Law of Supply & Demand from a 6 Paths Spike Indicator Perspective 328 The Law of Cause and Effect from a 6 Paths Spike Indicator Perspective 329 The Law of Effort Versus Result from a 6 Paths Spike Indicator Perspective 329 Case Studies-Major Tops and Bottoms from a 6 Paths Spike Indicator Perspective 332 19 Quantifying Stock Market Manipulation 335 The Mathematics of Churning Stocks Without Being Seen 335 Case Study-Was Abnormal Shorting Activity Taking Place? 340 Case Study–Do Raging Bull Campaigns Still Occur? 343 Case Study-Richard Ney’s Claim of Manipulation of the DJIA 30 Stocks 346 Quantification-Could the IBM Specialist Make Substantial Profits? 347 IBM-The True Story Comes Out 351 20 Action and Reaction, Price Tunnels and Long Term Price Vibration Forecasting 353 Step 1 - Sampling Minimal Risk Price Vibrations from the Past 353 Step 2 – Applying a Minimal Risk 40.7% Annualized Money Value Rate Angle 355 Step 3 – Apply the Minimal Risk Price Vibrations from the Past to the Future 356 Step 4 – Identifying any Structural Changes in the Price Channels 357 Step 5 – Relative Strength Vibration Comparisons 358 Step 6 – The Money Value Vibration Viewing Perspective 361 A NASDAQ Case Study, Looking for a Trump Effect on Prices 365 The Four Fang Stocks 367 An alternative perspective as to whether History was Repeating 371 21 Interactive Short-Term Forecasting 375 Geometrical Angle Forecasting Utilizing the Forces of Supply & Demand 375 22 Gann’s Master Time Factor, Identified, Explained, and Tested 381 Prof. Weston’s Jupiter/Saturn Synodic Cycle 1928 Research Paper 382 Prof. Weston’s 10-Year Pattern 386 My Musings about Gann’s Interactions with Prof. Weston 387 Gann’s Time Cycles 390 Gann’s Problematic Dataset Sizes for Working Out Great Time Cycle Periods 392 Annual Stock Market Patterns Are Not the Same as Time Cycles 393 Decennial Pattern Research Compared to 10-year Time Cycles in the US Financial Markets 394 Gann’s Master Time Factor Identified 398 Comparison of Gann’s MTF Pattern to other Decennial Pattern Research Conclusions 400 What Causes 10-Year Cycles and Decennial Patterns? 402 Identifying Gann’s “Rules for Future Cycles” 403 Compliance Test of the 1936 MTF Pattern with Gann’s “Rules for Future Cycles” 405 Compliance Test of Prof. Weston’s Pattern to Gann’s “Rules for Future Cycles” 406 The Conundrum “Rule 7 for Future Cycles” 408 The Numerology of Gann’s 1936 MTF Pattern 410 The Accuracy of the 1936 MTF Pattern for Forecasting the Stock Market – an 8-Year Test 410 The Accuracy of the 1936 MTF Pattern for Forecasting the Stock Market –a 60-Year Test 412 Calculating a Single “Law of Price Vibration” Rate to use with Gann’s 1936 MTF pattern 415 The Accuracy of the 1936 MTF Pattern for Forecasting the Stock Market – a 40-Year Test 415 Does Gann’s MTF Pattern Still Work -a 28-Year test well into the early part of the 21st Century 418 23 Conclusions About Different Chart Reading Perspectives 420 A Wykoff Case Study by Jim Forte 420 The 6 Paths Minor and Major Creek Indicator Perspective 423 Two 6 Paths Bal% Spike Indicator Perspectives 425 6 Paths Forensic and Periodic Analyses Perspectives of Forte’s Case Study 425 Two Wykoff Case Studies by Richard A. Dickson and Tracy L. Knudsen 427 A Third Wykoff Case Study by Jim O’Brien 432 Appendix A Seeking Gann’s (Later in Life) Understanding of Supply & Demand 437 Appendix B Looking Back in Time at Perceived Time Cycles 444 Looking Back at Perceived Time Cycles at Tops, or the End of Bull Campaigns 446 Looking Back at Perceived Time Cycles at Panic Years or the End of Bear Campaigns 449 Gann’s 1929 Forecast 452 Appendix C Real Cycles and Real Waves 455 The Snake to Serpent, Time, Price and Cycle, Indicator 455 Further Example-The Snake to Serpent with SM Bal% Measurement Indicator 460 Using the Forces of Supply & Demand to Identify Real Cycles 461 Catching a Single Vibration and Turning it into a Wave and then into a Cycle 464 Sampling Multiple Vibrations, and the Derived Forecasting Wavelets 465 Appendix D Difficulties EW Experts had Agreeing on their Elliott Wave Forecasts 470 Appendix E Mechanics for Constructing a Planetary Line Indicator 474 Long Form Code for a Planet Line and Harmonic Line Vibration Indicator 475 Short Form Code for a Planet Heliocentric Trading Day Indicator 478 Long Form and Short Form Planetary and Harmonic Lines, and Other Vibration Examples 482 What do Planetary Lines Represent? 485 About the Author 486 Bibliography 487 ------------- BC User since June 2007 |
Posted By: paulchow2k
Date Posted: 20 Jul 2018 at 9:32pm
| i cant find the book anywhere |
Posted By: cmacdon
Date Posted: 21 Jul 2018 at 7:25am
|
Dear Paulchow2K Sorry but I have been rewriting the book yet again, so it does not read like a research thesis, and trying to reduce it's size as it got up to 530 pages 8x11 size which is too big and costly to produce as a printed book. I am re-jigging the first 14 chapters. I discovered an explanation of Gann's Master Time Factor (MTF) in his own writings about two years ago. A current delay was caused as I believe , in this latest rewrite I found one of his methods from his own writings that probably was an application of his early concept about a Law of Vibration. Most folk do not believe Gann ever explained his Law of Vibration after his 1909 interview with Wyckoff but I think he just renamed the approach for marketing purposes, as the same logic seems to underlay a number of his later methods, but he named them differently when he disclosed them over time. It took me some time to code the indicators correctly in Bullscript, I have adapted the concept to measure the total, average and marginal volume based on Gann's Law of Vibration logic although Gann did not use volume for his explanation and time and price rules that underlay the particular method. I have further adapted the indicator to measure stock price vibrations, annualized money value vibrations, and develop appropriate geometrical angles. Given my pace and constant revisions, I expect I am now still a few months away from sending a finished draft to a publisher. Charles
------------- BC User since June 2007 |