Bollinger band Squeeze
Printed From: BullCharts Forum
Category: BullCharts
Forum Name: BullScript
Forum Discription: Technical discussion related specifically to the BullScript programming language.
URL: http://www.bullcharts.com.au/forum/forum_posts.asp?TID=983
Printed Date: 18 May 2024 at 11:32pm
Software Version: Web Wiz Forums 9.69 - http://www.webwizforums.com
Topic: Bollinger band Squeeze
Posted By: cmacdon
Subject: Bollinger band Squeeze
Date Posted: 11 Mar 2015 at 4:03pm
|
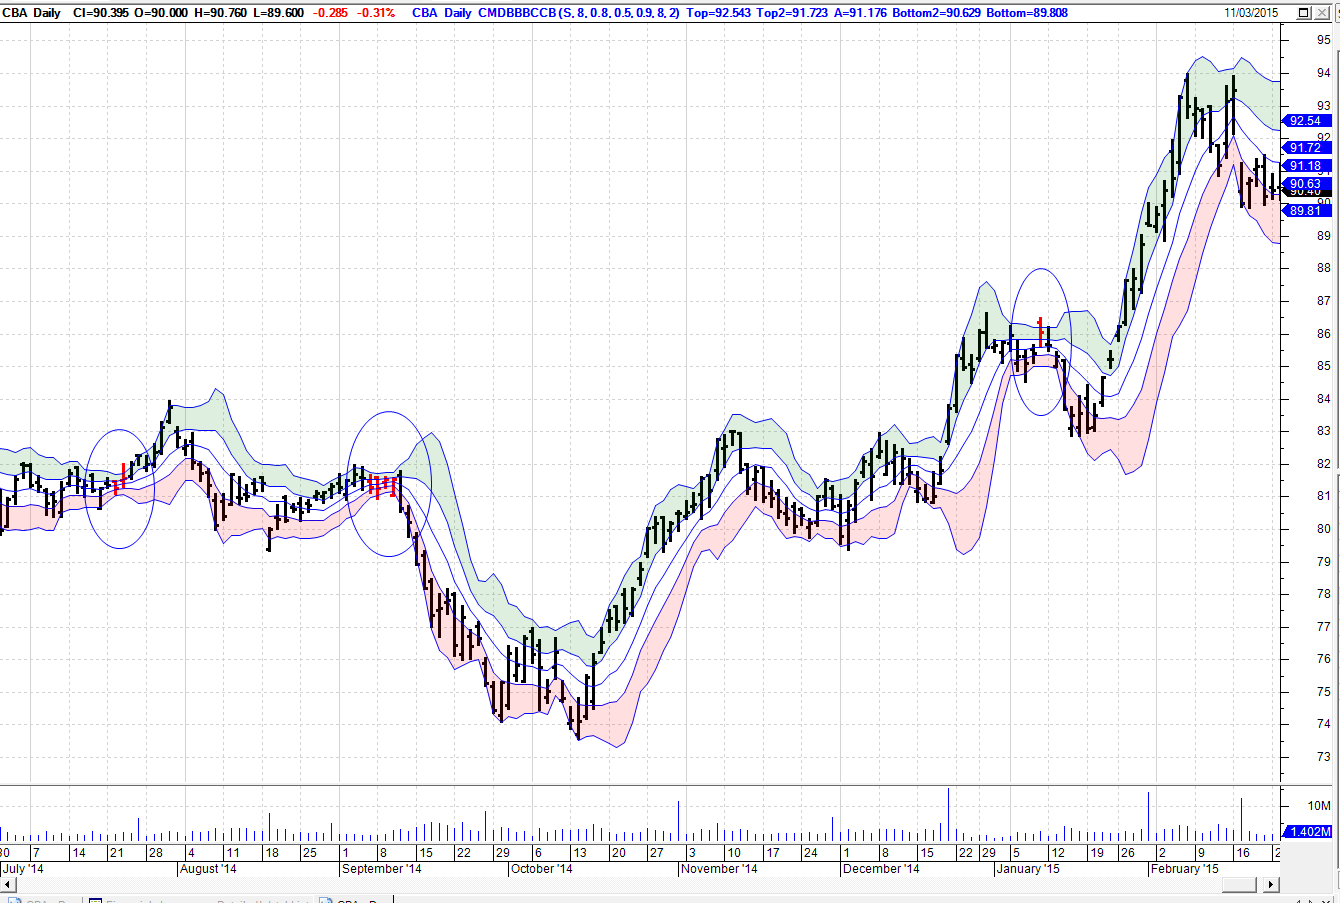
In response to a general discussion query on Bollinger Band Squeezes, I had this amended indicator code in my archives for some time it allows you to have full controll over identifying Bollinger Band Squeezes (which are called "Bingo" bars in my indicator as it also allows you to also identify "Bongo" bars which are high volatilty bars. You can tailor the levels of volatility in the indicator set up. If you go into style you can switch all the usual BB chart features on but by default I had them turned off and red colour bars would show the Squeeze bars without all the other BB distractions
In the code later you will also see you can substitute a truncated Pldot code for the Close in the expression formula line and this gives smoother BBs. Also some hidden code if you want to monitor Bongo more volatile bars as distinct from the BB Squeeze low volatility bars which can also be identified by turning the markers on in the styles area. If you do that you can scan for the Bingo low volatility bars or Bongo high volatility markers in Bullscan I will post a chart then the code Charles ------------- BC User since June 2007 |
Replies:
Posted By: cmacdon
Date Posted: 11 Mar 2015 at 4:06pm
 ------------- BC User since June 2007 |
Posted By: cmacdon
Date Posted: 11 Mar 2015 at 4:07pm
|
[description="Bollinger Bands are indicators that are plotted at standard deviation levels above and below a simple moving average. Since standard deviation is a measure of volatility, a large standard deviation is a good indicator for a volatile market, while a smaller standard deviation is an indicator of a calmer market.
Bollinger Bands are a good way to compare volatility and relative price levels over a period of time."] [citation="Technical Analysis from A-Z - Steven B. Achelis Second Edition"] [target=Price; category=Bands; author=Bollinger, John] {This is truncated PLDOT which can give Smoother BB that using C in the expr i.e. substitute expr=TrApldot instead of expr=C} TrApldot:=(((hist(h,0)+hist(Low,0)+hist(C,0))/3)+((hist(h,1)+hist(Low,1)+hist(C,1))/3) )/2; expr := C; method := inputma("Method",SIMPLE); n := input("Time periods",8,1); sd := input("Standard Deviations",0.8,0.1); sqn := input("Min ATR for the Squeeze",0.5,.001); sqn2 := input("Max ATR for the Squeeze",0.9,.001); n2 := input("Time periods",8,1); sd2 := input("Standard Deviations",1.6,0.1); [visible=false] [name=Top] top:=bbandtop(expr,n2,method,sd2); top; [name=Top2] top2:=bbandtop(expr,n,method,sd); top2; [name=Average] {pldot;} ave:=ma(expr,n,method); ave; [name=Bottom2] Bot2:=bbandbot(expr,n,method,sd); Bot2; [name=Bottom] Bot:=bbandbot(expr,n2,method,sd2); Bot; [name=Cross; linestyle=marker; marker=type1; ] [tooltip="BB Signals Cross"] cross(Bot,Bot2) or cross(Bot2,Bot); { Markers } [name=Lower; linestyle=marker; marker=type1; tooltip="Value passed below the lower band"] cross(bbandbot(expr,n,method,sd),expr); [name=Upper; linestyle=marker; marker=type2; tooltip="Value passed above the upper band"] cross(expr,bbandtop(expr,n,method,sd)); [name=LowerInner; linestyle=marker; marker=type1; tooltip="Value passed below the lower innerband"] cross(top2,h); [name=UpperInner; linestyle=marker; marker=type2; tooltip="Value passed above the upper innerband"] cross(l,Bot); {This is what I need for monitoring the Squeeze} [name=Bingo; linestyle=marker; marker=2; tooltip="Bingo"; Colour =Black;] Sq:=(Top2-Bot2)<sqn*ATR; Sq; [name=Bongo; linestyle=marker; marker=1; Colour =Lime; tooltip="Bongo"] Sqmx:=(Top2-Bot2)>sqn2*ATR; Sqmx; { Fill } [name=Fill; linestyle=fill; visible=false] [color=green] top; [color=red] top2; [name=Cross; linestyle=marker; marker=type1; ] [tooltip="BB Signals Cross"] cross(Top,Top2) or cross(Top2,Top); { Bottom Fill } [name=Fill; linestyle=fill; ] [color=green] Bot; [color=red] Bot2; [linestyle=pricecolor] [name=Bingo; tooltip="Bingo"; Color =Red; visible=true] Sq1:=if((Top2-Bot2)<sqn*ATR,1,undefined); Sq1; {Some unused colour bar code if you are monitoring widest range rather than the narrowest Squeeze} { [name=Bongo; Color =Lime; tooltip="Up"] Sqmx1:=If(Sq1=undefined AND C>=ave,1,undefined); Sqmx1; [name=Bongo; Color =Red; tooltip="Down"] Sqmx2:=If(Sq1=undefined AND C<ave,1,undefined); Sqmx2; } ------------- BC User since June 2007 |