Convert Chandelier indicator from Metastock to BC
Printed From: BullCharts Forum
Category: BullCharts
Forum Name: BullScript
Forum Discription: Technical discussion related specifically to the BullScript programming language.
URL: http://www.bullcharts.com.au/forum/forum_posts.asp?TID=967
Printed Date: 19 May 2024 at 4:50am
Software Version: Web Wiz Forums 9.69 - http://www.webwizforums.com
Topic: Convert Chandelier indicator from Metastock to BC
Posted By: Alan
Subject: Convert Chandelier indicator from Metastock to BC
Date Posted: 05 Sep 2014 at 5:39pm
|
Hi All,
Please could somebody help me with the conversion of this Chandelier trailing stop (long Trade) from Metastock code to Bullcharts. Chandelier Trailing Stop Loss MetaStock
Codes Many thanks, Alan |
Replies:
Posted By: Niftyg
Date Posted: 06 Sep 2014 at 10:22am
|
Hi Alan,
Try this, dataarray:=input("Data array. Enter a number 1=o, 2=h, 3=l, 4=c", 4, 1, 4); value2:=If(dataarray=1,O,If(dataarray=2,H,If(dataarray=3,L,If(dataarray=4,C,C)))); multiplier:= input("Enter ATR multiplier ", 3, 1, 10); atrperiods:= input("Enter ATR periods", 15, 1, 39); hhvperiods:= input("HHV Period", 20, 1, 50); HHV(value2 - multiplier*ATR(atrperiods),hhvperiods) Regards Nifty |
Posted By: Alan
Date Posted: 06 Sep 2014 at 11:19am
|
Hi Niftyg, That seems to have worked perfectly. Please can you assist with another conversion and query. Here is the Metastock code for a Chandelier with a date: Chandelier with Date dataarray:=Input("Data array. Enter a number 1=o, 2=h, 3=l, 4=c",1,4,4); value2:=If(dataarray=1,O,If( ls:= Input("Direction. Long=1, Short=2",1,2,1); d:= Input("day of month",1,31,26); m:= Input("month",1,12,5); y:= Input("year",1950,2020,2009); ml:=Input("multiplier",1,10,3) si:=d=DayOfMonth() AND m=Month() AND y=Year(); q:=If(ValueWhen(1,si,1), If(ls=1,Highest(q-ml*ATR(15)), Here is the code in Bullcharts format: expr := expression("Expression"); TDate :=InputDate("Date of trend", date(2009,5,26)); ml := input("Time periods",3,1); ValueATR := Input("ATR Periods",15,3); ls := input("Direction", 1, 1, 2); q:=If(onorskipped(TDate)or prev > 0,expr,0); result:=If(ls=1,Highest(q-ml*ATR(15)),Lowest(q+ml*ATR(15))); result; The issue that I have is when I add this indicator to a chart, and give it a start date, say 1 July 2014, the chandelier indicator line then add a straight line from zero stock price to the price at the date nominated. This causes the chart to look really horrible and you can not see the prices or chart. Is there a way to start this indicator on the date selected and the the chandelier starts at the correct value, without going down to zero. I hope this makes sense. I'm struggling to load a picture to make it easier to see what I mean. |
Posted By: Alan
Date Posted: 06 Sep 2014 at 5:10pm
Here is a picture of the current issue: As you can see, the Chandelier stop should start at 1 July in this example, however it draws in a vertical line down to zero. This distorts the chart.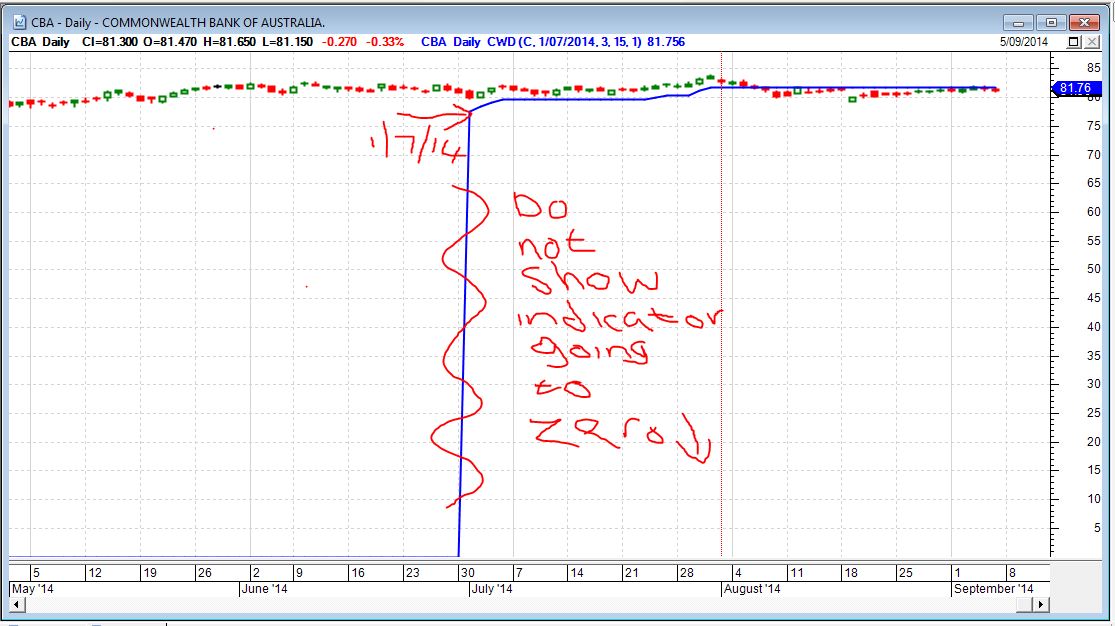 |
Posted By: cmacdon
Date Posted: 11 Sep 2014 at 4:25pm
|
Alan
Have a look through previous comments and posts on the Forum and you may be able to solve a lot of your problems. Go to the previous posts on coding trailing stop loss indicators and you should be able to adapt the Chandelier coding you already have above to get what you want. My version of the trailing stop loss based on Michael Jenkins work had an option to base the stop loss off an ATR calc. Also, if you want to just apply a stop loss indicator from a particular starting date, look at these two lines in the very recent Seasonal Date and Market Structure post which shows how the lines work and you should be able to fix your issue immediately above. Charles TDate:=InputDate("Date of trend", date(2014,7,10)); HD:=BarsSince(OnOrSkipped(TDate)); ------------- BC User since June 2007 |
Posted By: Alan
Date Posted: 11 Sep 2014 at 8:34pm
|
Hi Charles, Thanks for the info and advise. Unfortunately, I'm not a programmer or script writer, so I'm really not sure what the code is or how to correct it. I copied and pasted your 2 lines of code into my indicator, but that did not work. I'm sure there is some code that I would need to remove etc. Cheers, Alan
|
Posted By: cmacdon
Date Posted: 12 Sep 2014 at 1:59am
|
{ Alan THis works applied to Niftyg's coding
Set a date or Click on the indicator and a line appears then drag th default start date across to any date you want} [Target=Price;] TDate:=InputDate("Date of trend", date(2014,7,1)); HD:=BarsSince(OnOrSkipped(TDate)); dataarray:=input("Data array. Enter a number 1=o, 2=h, 3=l, 4=c", 4, 1, 4); value2:=If(dataarray=1,O,If(dataarray=2,H,If(dataarray=3,L,If(dataarray=4,C,C)))); multiplier:= input("Enter ATR multiplier ", 3, 1, 10); atrperiods:= input("Enter ATR periods", 15, 1, 39); hhvperiods:= input("HHV Period", 20, 1, 50); If(HD,HHV(value2 - multiplier*ATR(atrperiods),hhvperiods),undefined); ------------- BC User since June 2007 |
Posted By: cmacdon
Date Posted: 12 Sep 2014 at 2:37am
|
{I am watching a boring webinar so here is a coloured bar version}
[Target=Price;] TDate:=InputDate("Date of trend", date(2014,7,1)); HD:=BarsSince(OnOrSkipped(TDate)); dataarray:=input("Data array. Enter a number 1=o, 2=h, 3=l, 4=c", 4, 1, 4); value2:=If(dataarray=1,O,If(dataarray=2,H,If(dataarray=3,L,If(dataarray=4,C,C)))); multiplier:= input("Enter ATR multiplier ", 3, 1, 10); atrperiods:= input("Enter ATR periods", 15, 1, 39); hhvperiods:= input("HHV Period", 20, 1, 50); a:=If(HD,HHV(value2 - multiplier*ATR(atrperiods),hhvperiods),undefined); a; {--------This section takes up price colour bars--------} [linestyle=PriceColor;] [name=Close above SL level; Color= Blue;] ub:=If(c>=a,c,undefined); ub; [name=Close below SL level; Color=Red;] db:=If(c<a,c,undefined); db; ------------- BC User since June 2007 |
Posted By: cmacdon
Date Posted: 12 Sep 2014 at 2:48am
 ------------- BC User since June 2007 |
Posted By: Alan
Date Posted: 12 Sep 2014 at 9:15am
|
Hi Charles, Thanks very much for the code above. This is exactly what I was after. They work really well. If you are looking for a good trading site that has excellent webinars, then have a look at this one: www.bigmiketrading.com Cheers, Alan |