W D Gann's Stock vibrations and market structure
Printed From: BullCharts Forum
Category: BullCharts
Forum Name: BullScript
Forum Discription: Technical discussion related specifically to the BullScript programming language.
URL: http://www.bullcharts.com.au/forum/forum_posts.asp?TID=965
Printed Date: 19 May 2024 at 4:52am
Software Version: Web Wiz Forums 9.69 - http://www.webwizforums.com
Topic: W D Gann's Stock vibrations and market structure
Posted By: cmacdon
Subject: W D Gann's Stock vibrations and market structure
Date Posted: 22 Aug 2014 at 8:05pm
|
Here is a way to synthesise a few previous posts about Gann Case Studies, Market Structure and a way to focus in on W.D.Gann's concept of stocks having a particular vibration.
Gann did not really provide the formula for his vibration approach and there seem to be various hypotheses suggesting Astrological influences or Mathematical influences were the underlying basis for Gann's stock vibrations. So here is another partial concept. For this approach, I adapted a Slightly more flexible Market Structure indicator ( then previous market structure post) and applied it to the DJIA data which Gann commented on in case studies of a Bull and Bear Market campaign from 1915 to 1918 in his stock market course. I recall he did a similar case study covering later DJIA years in his book 45 Years In Wall Street. Reading the charts below, the comments relate to the point in time with a vertical line to the left of the comment. Some comments in green seem to be more general comments but they as typed exactly per the course albeit shortened comments in some instances. The qualitative verification of the appropriate vibration is being used is that the indicator set to the 5% vibration better reflects Gann's particular comments throughout the DJIA chart over the 3 years covering both the Bull and Bear campaigns. It is difficult to get further direct data for many of the other stock, commodities Gann discussed in his books and courses but DJIA data is obtainable back to the case study time. So, make up your own mind if the market structure and vibration indicator works. So,set out below is Gann's narrative for a Bull Market and Bear market campaign. I then applied either a 10% market structure indicator or a 5% indicator to the chart. The code for this Market Structure and vibration indicator is set out further below. It is same logic as previous post on Market Structure but with an alternative formula capable of picking up small or large vibrations (or %'s). ------------- BC User since June 2007 |
Replies:
Posted By: cmacdon
Date Posted: 22 Aug 2014 at 8:07pm
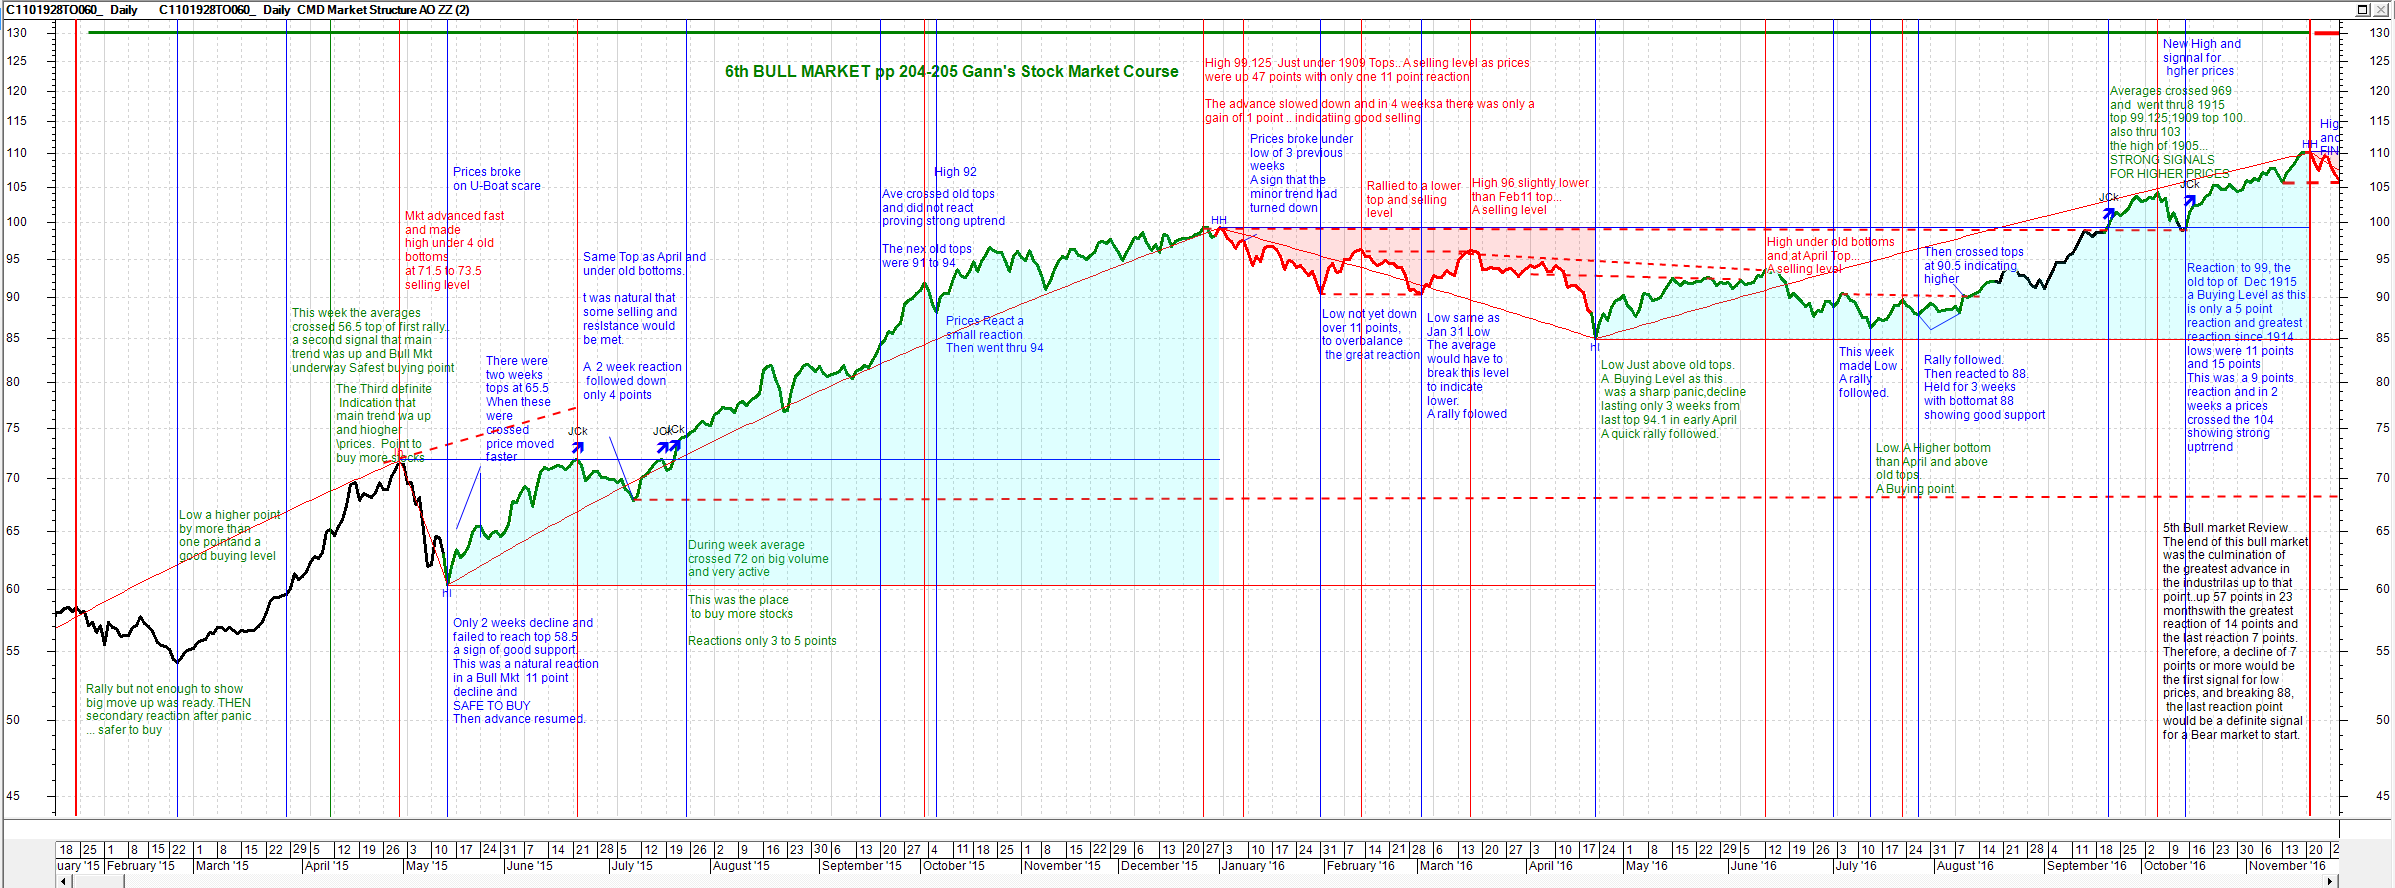
10% Vibration ------------- BC User since June 2007 |
Posted By: cmacdon
Date Posted: 22 Aug 2014 at 8:10pm
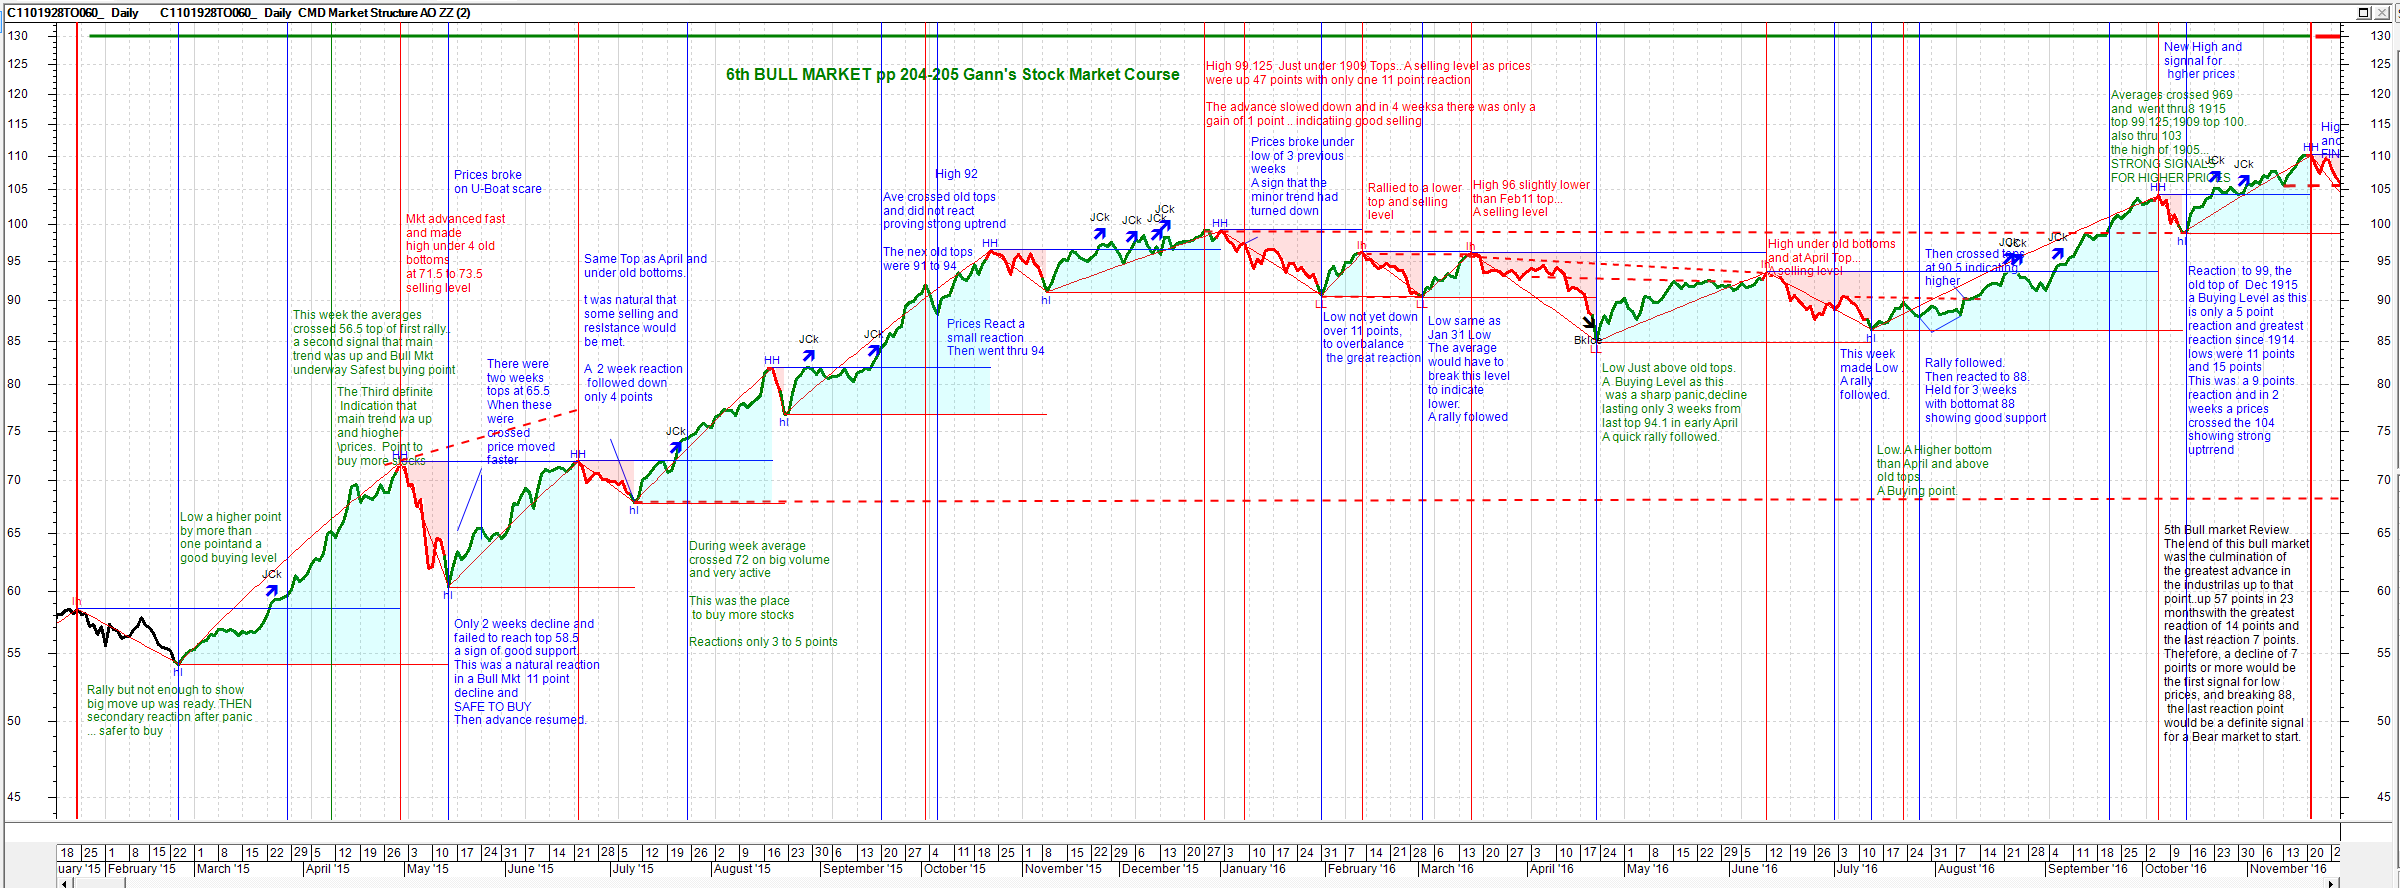
5% Vibration ------------- BC User since June 2007 |
Posted By: cmacdon
Date Posted: 22 Aug 2014 at 8:11pm
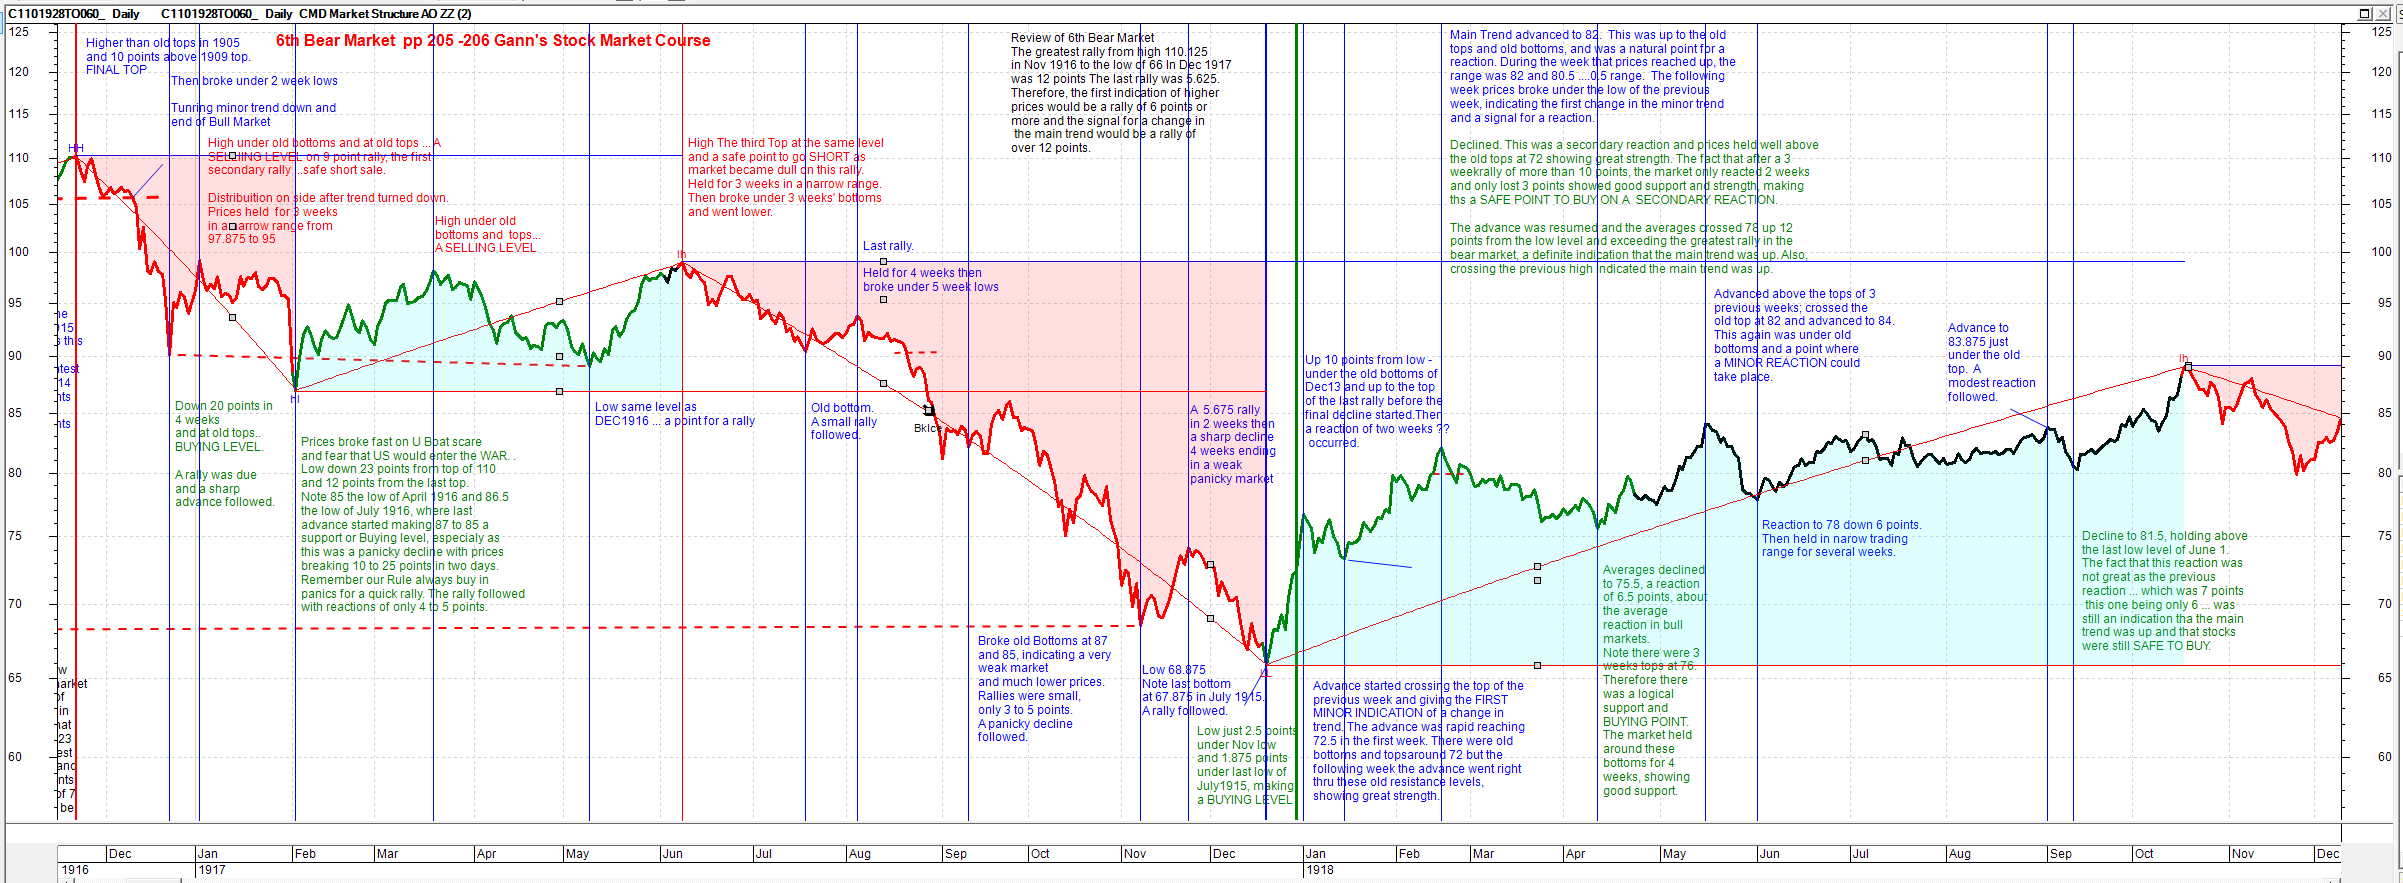
10% Vibration ------------- BC User since June 2007 |
Posted By: cmacdon
Date Posted: 22 Aug 2014 at 8:18pm
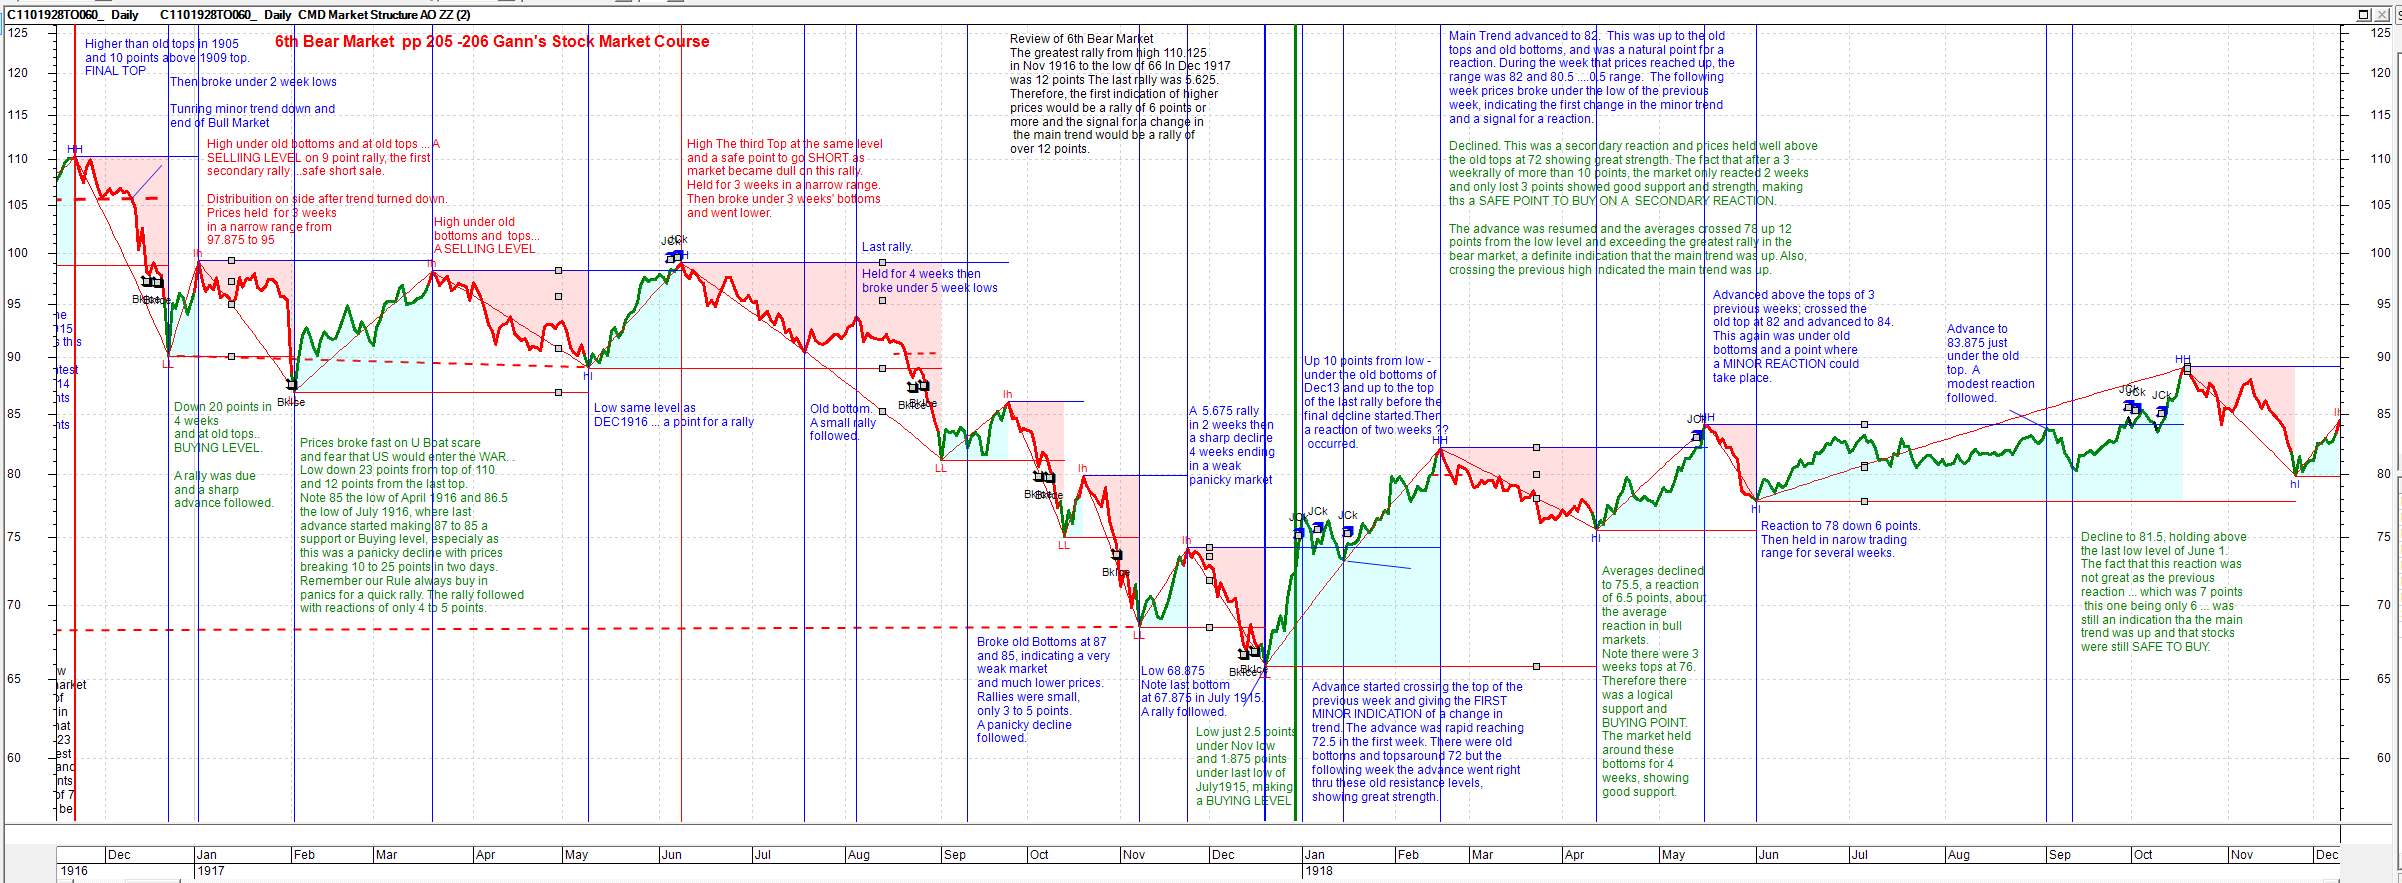
5% Vibration ------------- BC User since June 2007 |
Posted By: cmacdon
Date Posted: 23 Aug 2014 at 1:20am
|
{Cmacdon note: Step I- Work out what is the market structure definition your are happy to work with. }
[Description="Cmacdon For this example, I adapted a different indicator, to use as the market structure engine and applied it to W D Gann's Bull and Bear campaign DJIA analysis see previous case study posts"] [target=price; Visible=True] [target=Price] Vib:=input("Vibration", 4, .001, 100); z:=Zig(If(Outside() AND Ref(H,-1)>Ref(H,-2),H,If(Outside() AND Ref(L,-1)<Ref(L,-2),L,If((Outside() OR Inside()) AND C>O,H,If((Outside() OR Inside()) AND O>C,L,If(H>Ref(H,-1),H,If(L<Ref(L,-1),L,If(Ref(H,-1)>Ref(H,-2),H,If(Ref(L,-1)<Ref(L,-2),L,C)))))))),Vib,%); ispeak := z>hist(z,1) and z>future(z,1); istrough := z<hist(z,1) and z<future(z,1); [linestyle=Solid; color=Red] z; Upfractal:=If(ispeak, H*1.001,undefined); Downfractal:=If(istrough{L<ref(L,1) and L<ref(L,-1)}, L*0.999,undefined); {Text for interpreting market structure showing positive Blue structure Higher Highs(HH)and higher lows (ll), and negative structure, Lower Lows (LL), and lower highs (lh)} [name=HH; linestyle=Text;fontsize=8; textalign=Above,Centre; color=Blue;] if(Upfractal>Valuewhen(2,Upfractal,upfractal), + "HH ", +""); Upfractal*1.001; [name=lh; linestyle=Text;fontsize=8; textalign=Above,Centre; color=Red;] if(Upfractal>Valuewhen(2,Upfractal,upfractal), + "", +"lh"); Upfractal*1.001; [name=LL; linestyle=Text;fontsize=8; textalign=BELOW,Center; color=Red;] if(Downfractal<Valuewhen(2,Downfractal,Downfractal), + "LL ", +""); Downfractal*0.999; [name=hl; linestyle=Text;fontsize=8; textalign=BELOW,Center; color=Blue;] if(Downfractal<Valuewhen(2,Downfractal,Downfractal), + "", +"hl"); Downfractal*0.999; {----------This draws Lines I called Creek and Ice (Wyckoff terms)for want of names-------} HoldLevelPeriod := Input("Hold Level Period",100,1); FrU:=ValueWhen(1,UpFractal,UpFractal); FrUb:=If(H < FrU and barssince(UpFractal)<HoldLevelPeriod, FrU, undefined); [name=Creek; linestyle=Horz Step; color=blue; width=1] FrUb; FrD:=ValueWhen(1,DownFractal,DownFractal); FrDb:=If(L > FrD and barssince(DownFractal)<HoldLevelPeriod,FrD,undefined); [Name=Ice; linestyle=Horz Step; color=red; width=1] FrDb; {-----------------------------Colour Market Structure--------------------------------------} Switch:=if(barssince(valuewhen(1,upfractal))<barssince(valuewhen(1,downfractal)),Frub,Frdb); { Fill } [name=Market Structure Fill; linestyle=fill;] [color=Red] If((L>valuewhen(1,FRUb)),H,Switch); [color=Cyan] C; [linestyle=pricecolor] [color=Green] If( c>=valuewhen(1,FRU) OR switch =FRD and c>valuewhen(1,FRD),1,undefined); [color=Red] If( c<=valuewhen(1,FRD) OR Switch = FRU and c<valuewhen(1,FRU) ,1,undefined); [color=Black] ; [Visible=True] jck:=Cross(C,Valuewhen(2,FRU)); [name=JCk; linestyle=marker; marker=Long;align=Above; ] jck; bki:=Cross(Valuewhen(2,FRD),C); [name=BkIce; linestyle=marker; marker=short; align=Below;] bki; ------------- BC User since June 2007 |
Posted By: cmacdon
Date Posted: 25 Aug 2014 at 8:21pm
|
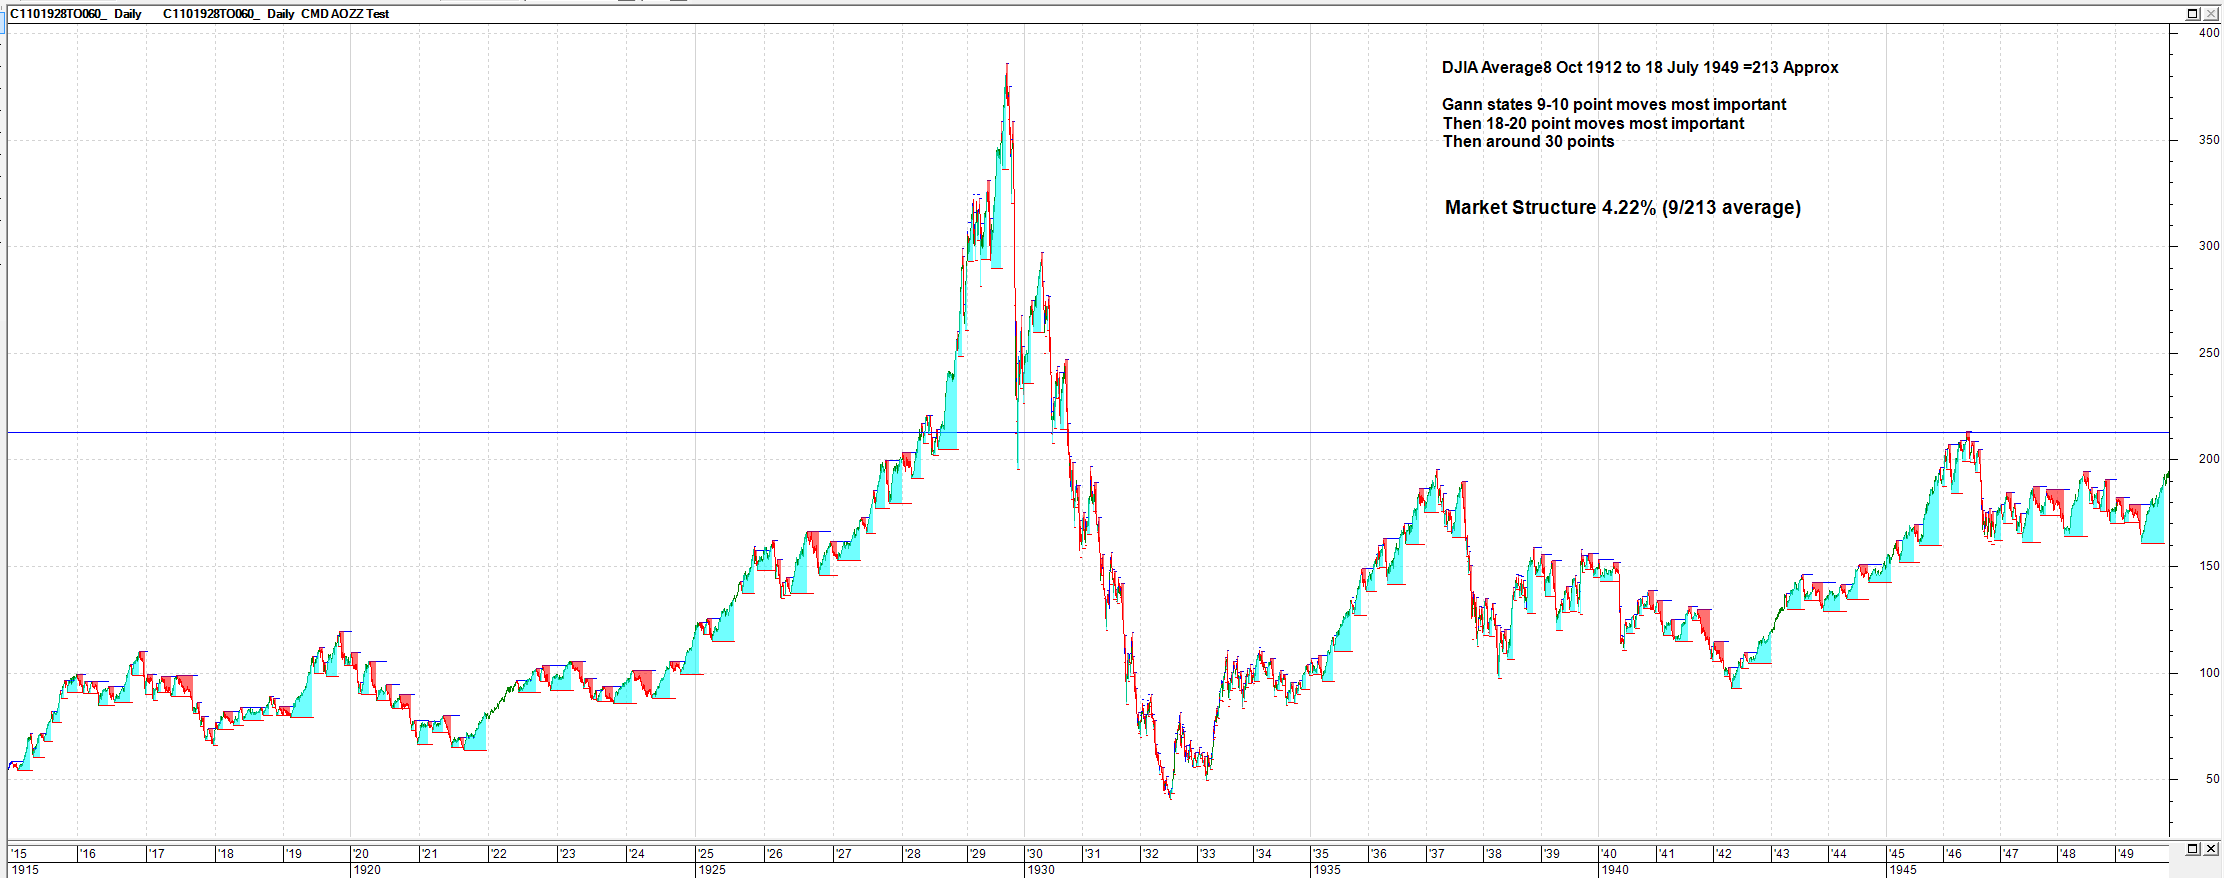
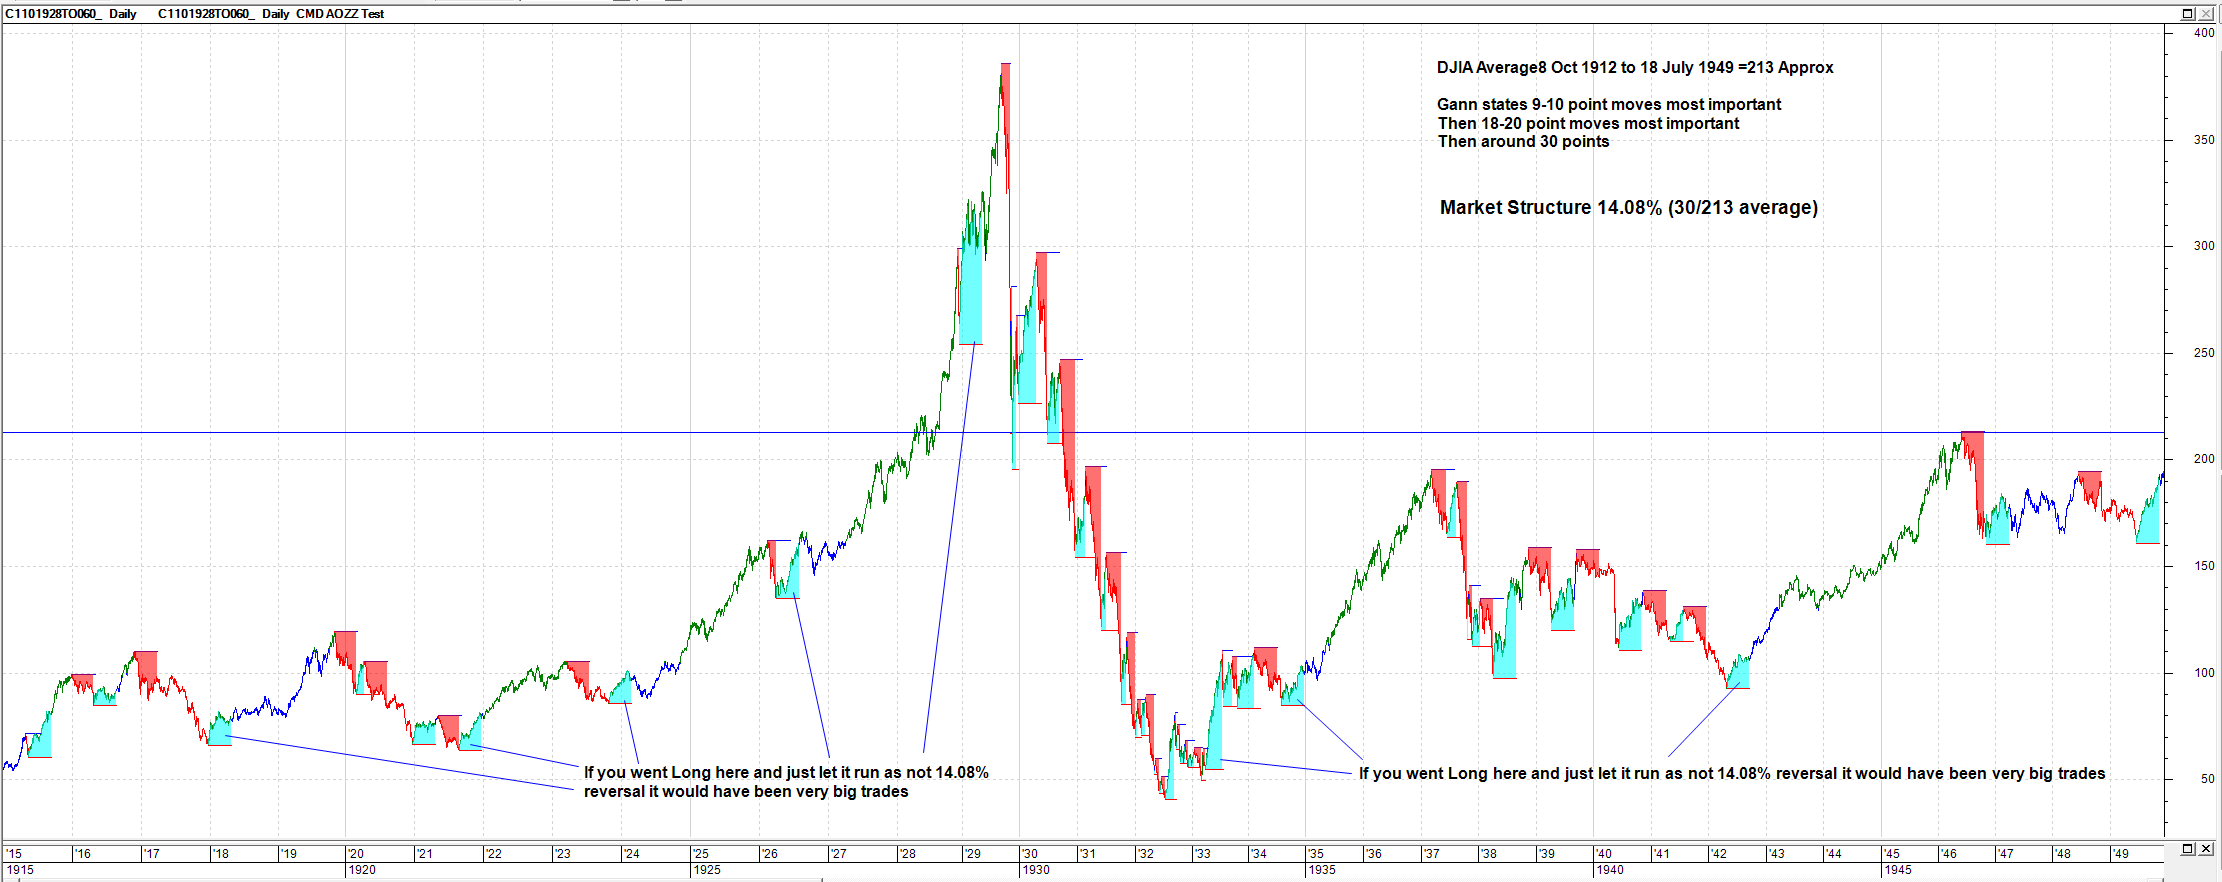
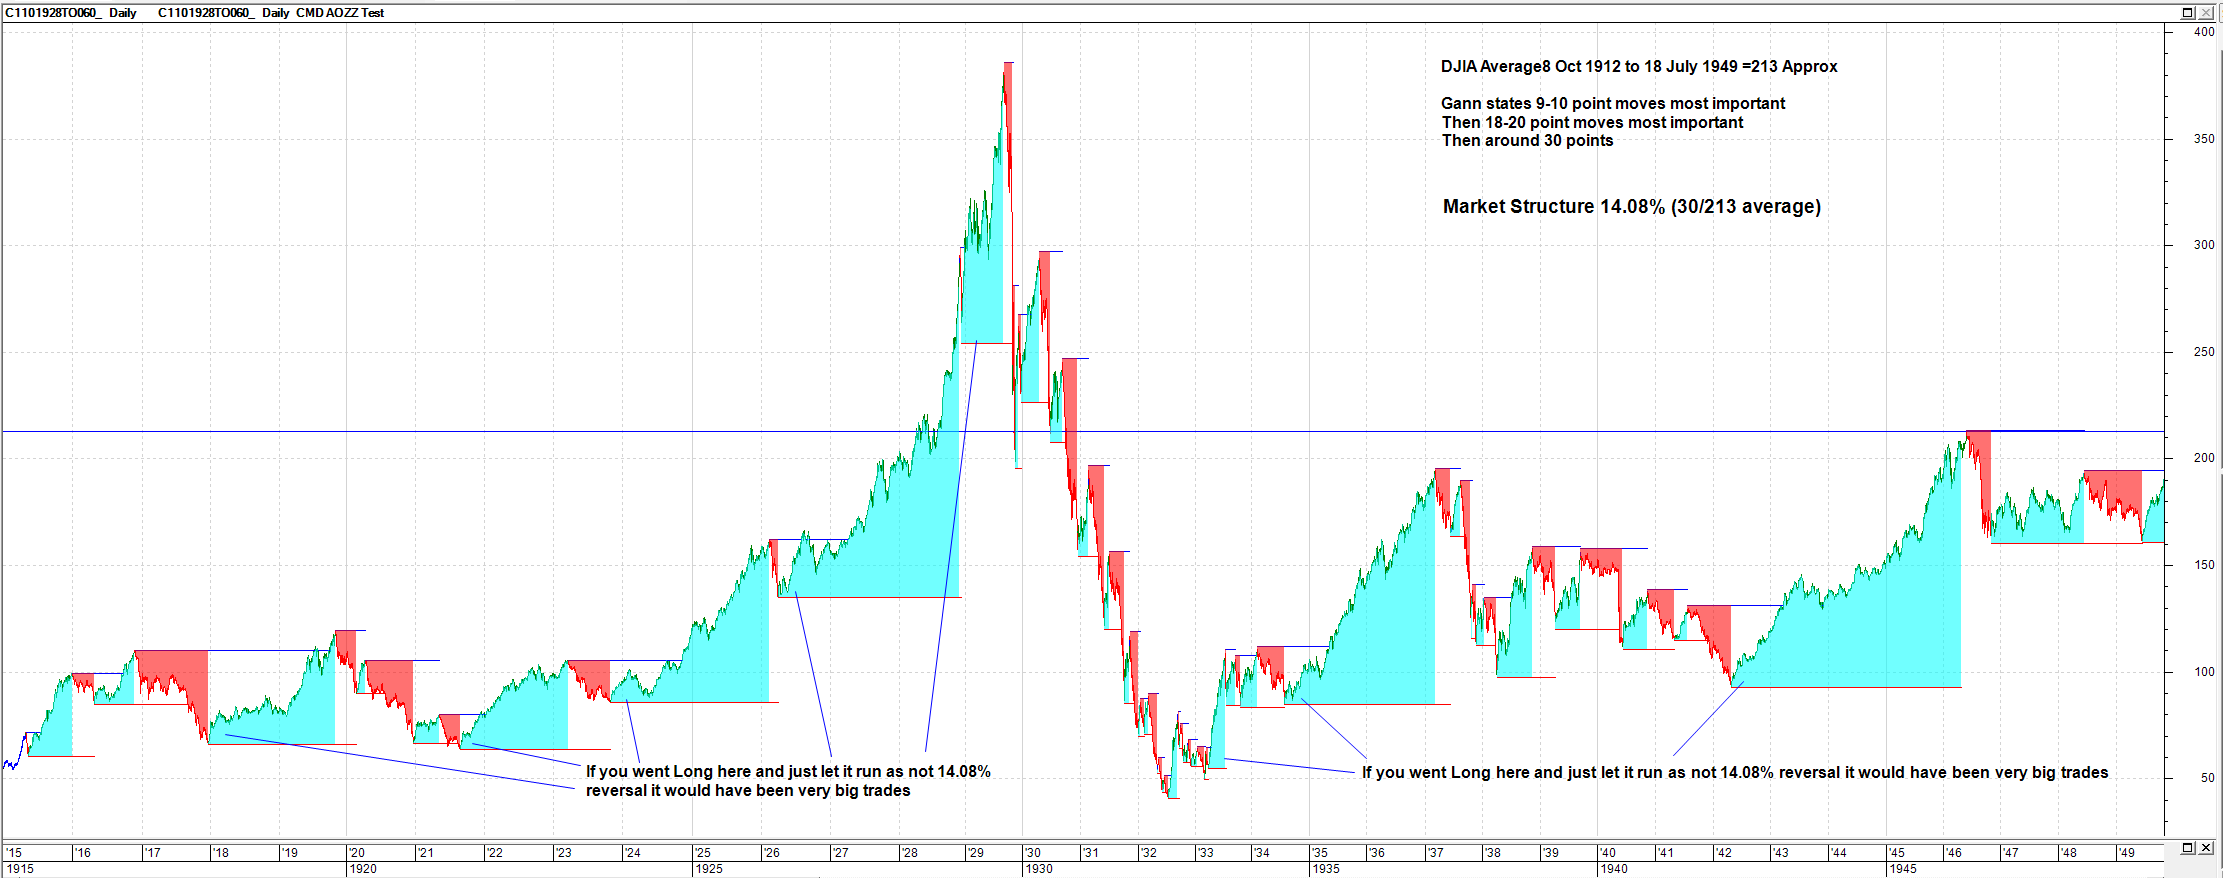
Here is some additional evidence that Gann was using 5% approx. swings on DJIA. In Chapter 6 of 45 years in Wall Street(see page 75 etc) Gann analyses the DJIA from October 1912 to July 1949 (see charts below) and states the 9 point Chart Swing is the most important and provides various statistics to support the DJIA was vibrating most around 9 points. After 9 to 10 points, he states the next most important is 18 to 20, and then around 30 points.
Over that period there was the build up in prices and Crash of 1929. The median point of the range for the 37 years appears to be about 213, (see Chart)so in percentage terms 9 points equates to 4.22% swing of the average and 30 points equates to a 14.08% swing on average. Applying the Market Structure indicator coded above, the two charts below are self explanatory of the DJIA covered by Gann's 37 year statistical analysis. The second chart indicates some positions where some very big long positions might have been taken using his guidelines using the 14.08% swings. ------------- BC User since June 2007 |
Posted By: cmacdon
Date Posted: 25 Aug 2014 at 8:22pm
 ------------- BC User since June 2007 |
Posted By: cmacdon
Date Posted: 25 Aug 2014 at 8:23pm
 ------------- BC User since June 2007 |
Posted By: cmacdon
Date Posted: 26 Aug 2014 at 8:40am
In this version 14.08% version (otherwise same as above) I extended the Hold level period from 100 to 1000
 ------------- BC User since June 2007 |
Posted By: cmacdon
Date Posted: 26 Aug 2014 at 6:43pm
|
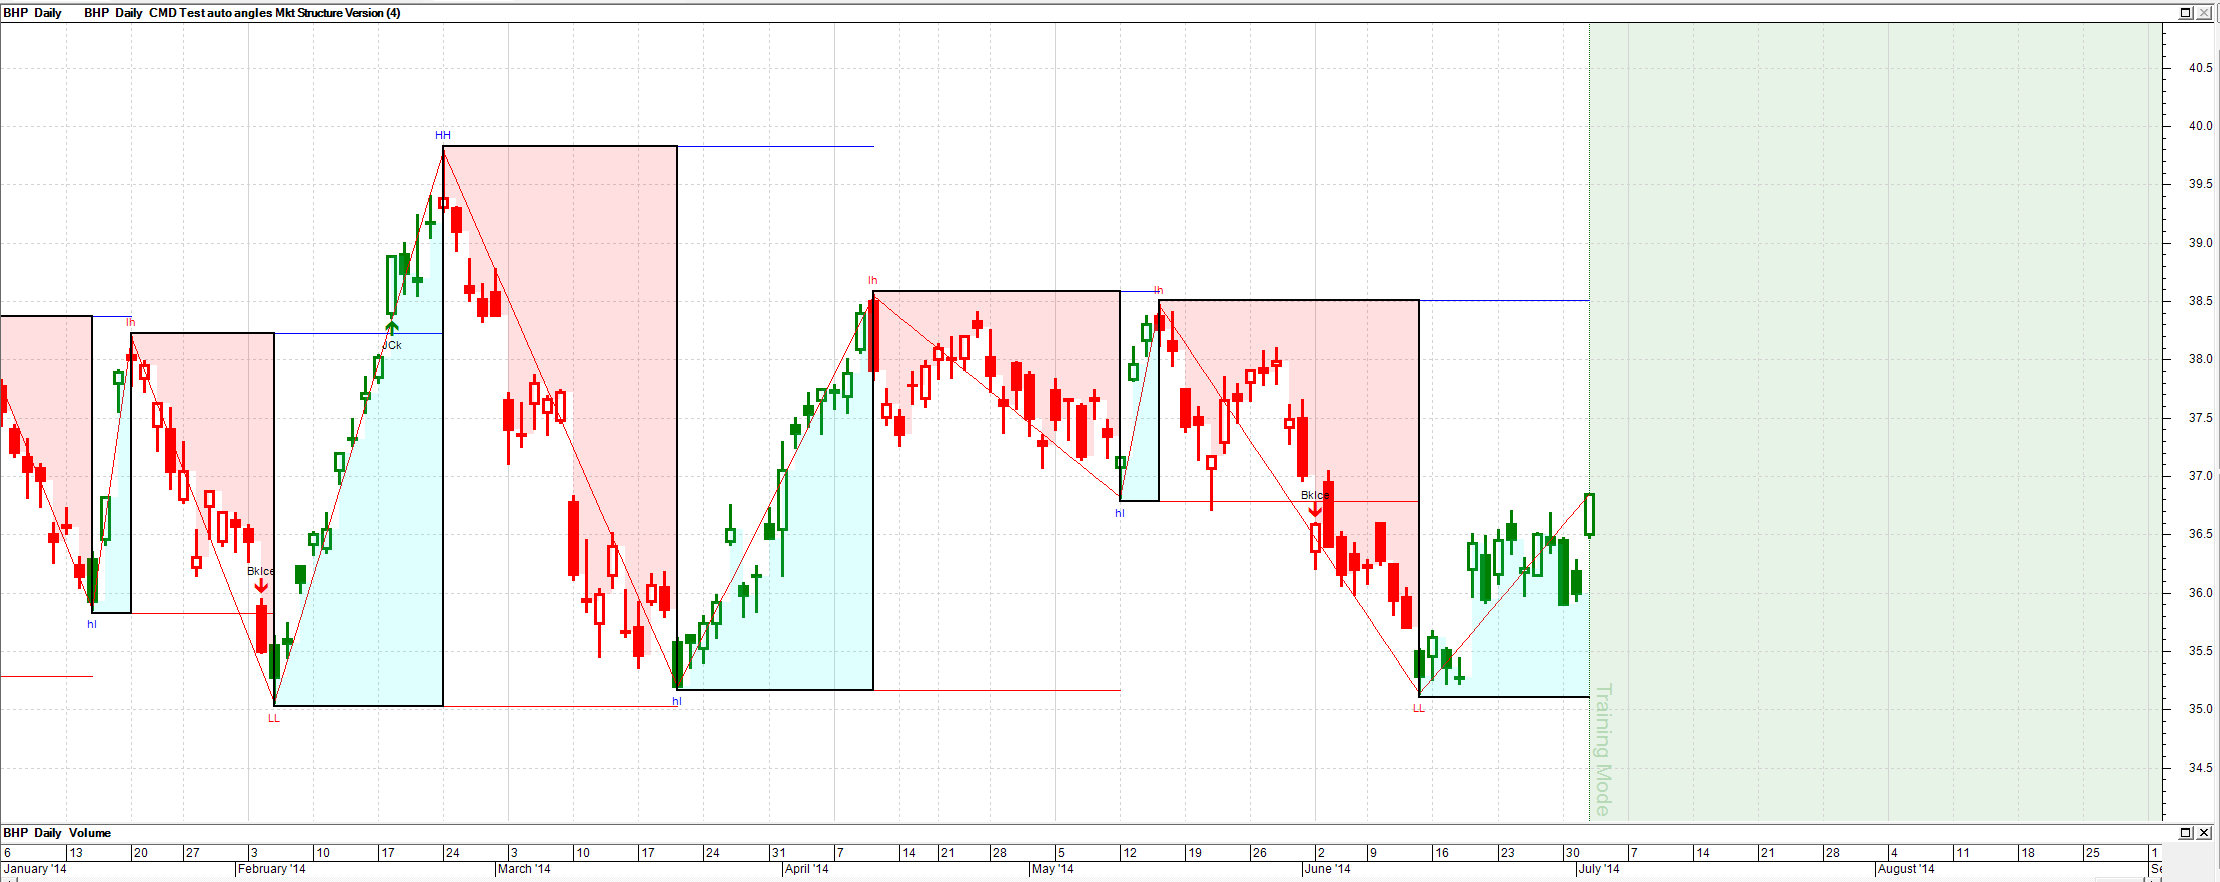
I thought I would point out that the market structure indicator can sometimes redraw. Some indicators e.g zig zag type indicator are quite good when you have very small parameters but when you have big parameter settings there may be a tendency to redraw recent bars due to price action hindsight. (This will be an issue in many cases if you do not understand your indicator so my suggestion might be just do not do scans on an indicator marker if you do not really knowing what the indicator code is doing).
I will show four charts below with the Bullcharts training mode on showing the potential problem, and an additional indicator that somewhat helps to mitigate the problem, as it tends not to redraw. The charts are: a) and b) Close up view of the market structure indicator using 4.44% per previous post. In some swings it captures the turning points quite well and quickly depending upon price action; however, in other cases if there is a bit of congestion around the turning point it might redraw the High or Low point after the event based on a bit of further hindsight from the subsequent price action. c) and d) The addition of another indicator may help reduce the chances of getting caught out if the additional indicator does not tend to redraw and you believe it is reliable for your style of trading. For this purpose, the second indicator I will use below to demonstrate the issue is named the Gann Hi-Lo indicator. I think it came from a conversion from a Metastock indicator I obtained some years ago from Tradersonline website but I did not record the original author, so have a look at the site to give him or her credit. I think the original concept of the Gann HiLo indicator was first coded, I believe by the late Robert Krauz, in his book, W.D. Gann Treasure Discovered based off a previously undiscovered Gann Course Krausz purchased privately. Anyway, I think it is a good indicator, so I provide my converted code below. You can click on the indicator and drag it across a chart in this Bullscript derivation. The additional indicator may help to avoid getting bamboozled by other indicators that redraw, albeit the redrawn other indicators might provide some good statistics of the market structure once a settled version has occurred. The Bullscript code for the Gann Hi Lo indicator is shown further below the charts. 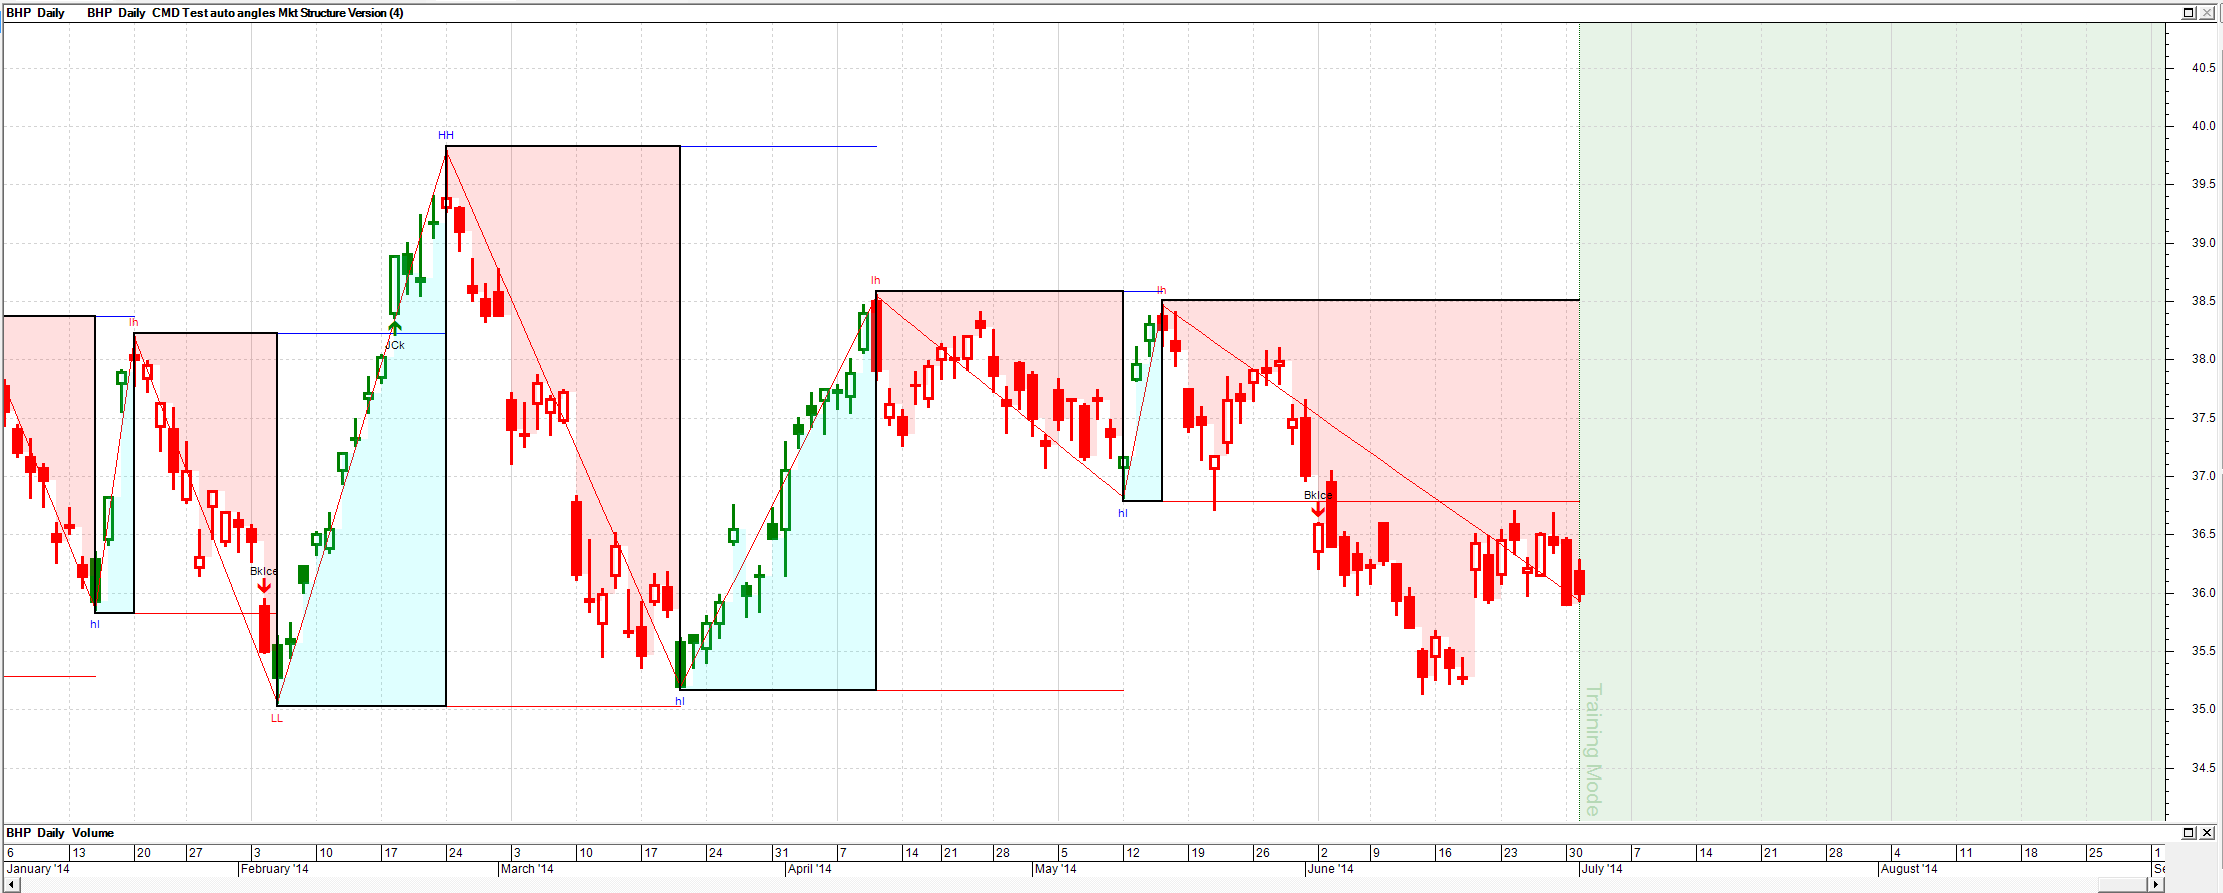 ------------- BC User since June 2007 |
Posted By: cmacdon
Date Posted: 26 Aug 2014 at 6:44pm
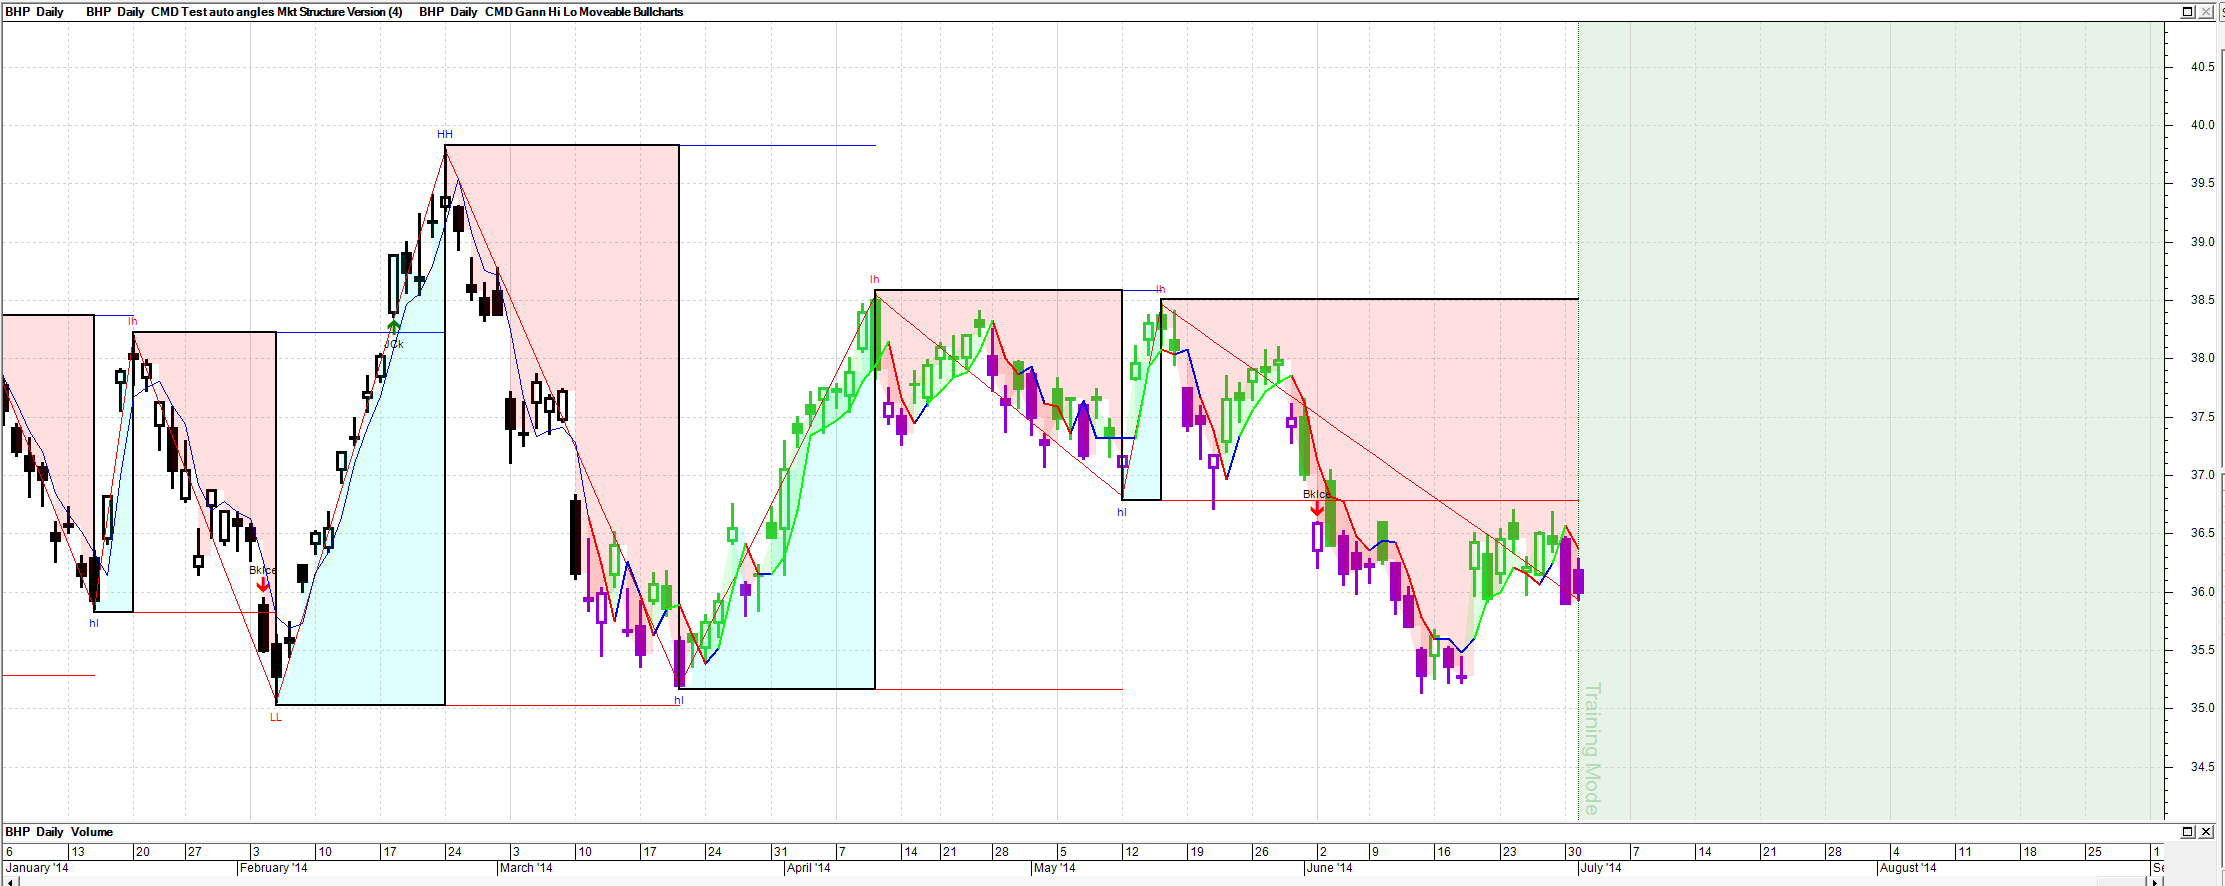
Note after the next bar the indicator redraws the last 6 to 8 congested bars and identifies the final trough and change to an uptrend mode but it came after the actual event.
 ------------- BC User since June 2007 |
Posted By: cmacdon
Date Posted: 26 Aug 2014 at 6:45pm
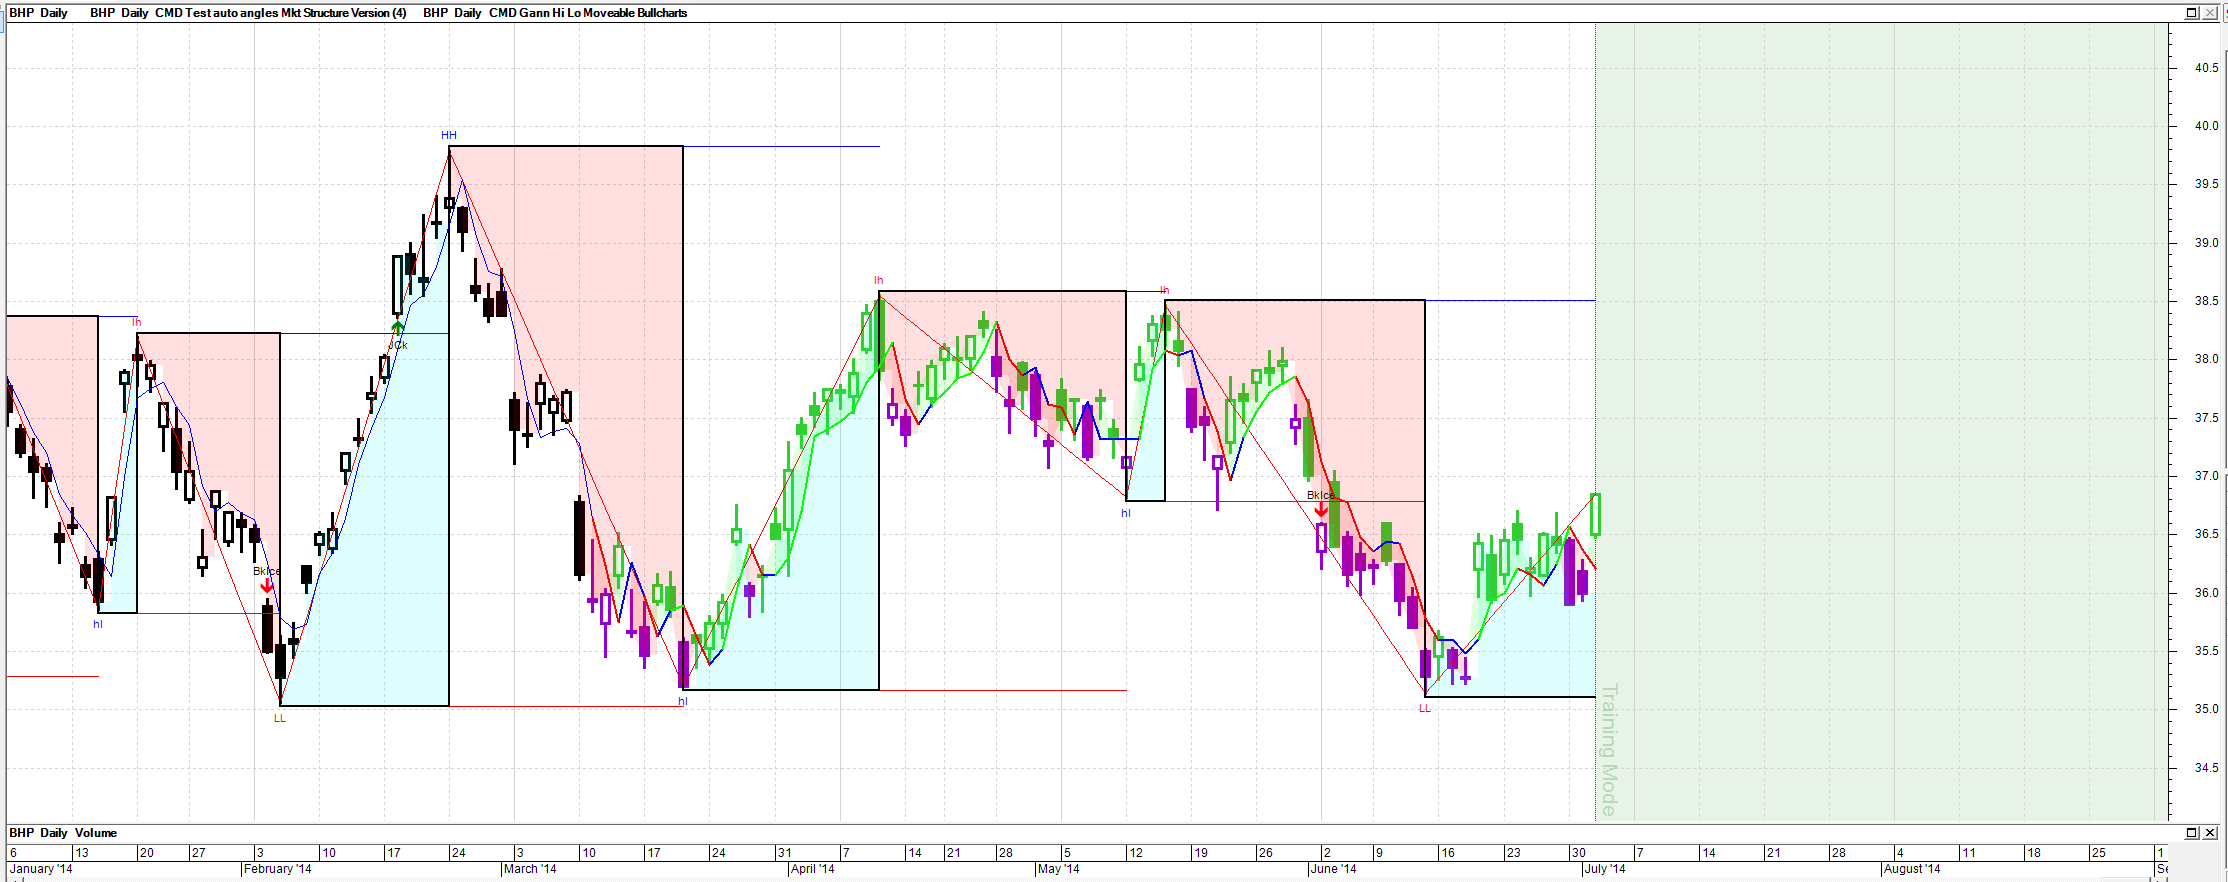
A way to get around this problem is to use an indicator that does not redraw and which you understand and are comfortable with using. This is the Gann Hi-Lo indicator set to 2 days turning points. I think it is a good indicator. Code is further below.
 ------------- BC User since June 2007 |
Posted By: cmacdon
Date Posted: 26 Aug 2014 at 6:55pm
|
{Cmacdon Note: Click on heading or the indicator on chart and black vertical line appears which you should drag across the chart to the bar before the turning point you wish to start from} [Target=Price;] TDate:=InputDate("Date of trend", date(2014,7,10)); HD:=BarsSince(OnOrSkipped(TDate)); pd:=input("Period", 2, 1, 10); HLd:=If(CLOSE>Ref(Ma(H,pd,S),-1), {then}1, {else}If(CLOSE<Ref(Ma(L,pd,S),-1), {then}-1, {else}0)); HLv:=ValueWhen(1,HLd<>0,HLd); HiLo:=If(HLv=-1, {then}Ma(H,pd,S), {else}Ma(L,pd,S)); HiLo; [name=Fill; linestyle=fill;] [color=Lime; ] if(HD,C,undefined); [color=Red; ] if(HD,HiLo,undefined); HiLoTrend:=if(HiLo>=Hist(HiLo,1),1,if(HiLo<Hist(HiLo,1),-1,prev)); [drawundefined=gap] [Linestyle=Solid; Width=2;] [name=HiLo; Color=Blue] pl1a:=if(HD AND HiLoTrend=1 and hist(HiLoTrend,1)=-1,HiLo,if(HD AND HiLoTrend=-1,HiLo,undefined)); pl1a; [Color=Red] pl2a:=if(HD AND HiLoTrend=-1 ,HiLo,if(HD AND hist(HiLoTrend,1)=1,HiLo,undefined)); pl2a; [Color=Lime] pl3a:=if(HD AND HiLoTrend=1 or HiLoTrend=0,HiLo,undefined); pl3a; [linestyle=pricecolor] [color=Lime Green] if(hd and H>=HiLO,1, undefined); [color=Dark Violet] if(hd and L<HiLo,1,undefined); [color=Black] true; ------------- BC User since June 2007 |