Stepped price Indicator
Printed From: BullCharts Forum
Category: BullCharts
Forum Name: BullScript
Forum Discription: Technical discussion related specifically to the BullScript programming language.
URL: http://www.bullcharts.com.au/forum/forum_posts.asp?TID=466
Printed Date: 19 Mar 2026 at 7:04pm
Software Version: Web Wiz Forums 9.69 - http://www.webwizforums.com
Topic: Stepped price Indicator
Posted By: RODCAM
Subject: Stepped price Indicator
Date Posted: 24 Mar 2008 at 7:02pm
|
Anyone able to help with an indicator I am trying to code. Conceptually all I want is to plot the closing price in steps as it increases or decreases by a set input percentage, a bit like a Renko chart but shown as a line chart. As an example, if the closing price starts a $5.00 and the input step amount is 10% the plot will show a $5 price until the actual close increases to $5.10 or it decreases to $4.90 etc. The plot continues but price increases or decreases are only shown as 10% increases or decreases. The intention is simply to filter out the noise in price movements until the price increases or decreases by the set amount (i.e. 10%). Therefore, the chart would appear as a series of 10% steps rather than fluctations of 1% or 2% or whatever revealed by a normal plot of closing prices. Not sure if the coding below helps but it may help explain what I am trying to achieve even though it does not work as I intended. The steps don't have to be precisely the input step increments but this is the minimum level in the step. For example, if the price increased by 12% then a step increase in the price by 6% would be shown in the plot, rather than just 10%. increase:= input("Step Size %",5);prev (if(C> hist(c,1)*(1+increase/100) OR C< hist(c,1)*(1-increase/100), C, if(C> hist(c,1)*(1+increase/100), hist(c,1)*(1+increase/100), hist(c,1)*(1-increase/100))));
Cheers RODCAM ------------- RODCAM - Brisbane |
Replies:
Posted By: maximo
Date Posted: 26 Mar 2008 at 2:14pm
|
Hi, Not quite sure what you mean.. like a picture says a 1000 words but unfortunately we dont have one. I worked on this percentage based indicator for visualising a % stoploss and also for confirmation of rising trends etc. It filters out the noise okay and you maybe able to adjust it to your needs. [citation =Percentage Trailing Stop][LineStyle =Solid; Target=Price; Color=Dodger Blue]Period:= input("LinearReg Average", 15, 1);Displace:= input("Risk Percent %", 2, 0);Flag:= input("Retreat (1=On, 0=Off)",1,0,1);DD:= If (Flag=0,Period,2);calc:= If(LinearReg(C,period)<PREV,If(LinearReg(C,period)+(ATR(period)*DD)<PREV,LinearReg(C,period)+(ATR(period)*DD),PREV),LinearReg(C,period));calc*(1-Displace/100);
|
Posted By: RODCAM
Date Posted: 26 Mar 2008 at 8:32pm
|
Maximo I drafted a clarification but somehow it did not get posted because I pushed the wrong button, so I'll try again. I want to create an indicator similar to the highest high (i.e. a step plot of prices showing series of plateaus with step ups and down) except that I want to set the minimum incremental step size, say to 10% as an example, which is plotted as a step chart. The plot would not show a step up or down unless the cumulative step increment/decrement was breached by the actual high price. For simplicity, let�s just use the table below to clarify. The step chart plot stays flat at 5.00 until the actual high price breaches the cumulative 10% step level (i.e. 5.0 +10% or 5.00 � 10%) in the first instance it is at period 6 when the actual high equals 5.50. The plot then remains flat until the next point where the step level is breached. (i.e. period 8 or 8.00) the plot then falls to 4.00 at period 10. My confusion relates to how to code so the reference point for calculating the cumulative step (i.e. at the point of each step up or down). On reflection perhaps my dilemma and shortcomings are much more deep seated. Step level = 10% Period: 1 ; 2; 3; 4 ; 5; 6; 7; 8; 9; 10; Actual price : 5.00; 5.10; 5.20; 5.30; 5.40; 5.50; 5.80; 8.00; 8.50; 4.00; Plot: & nbsp; 5.00; 5.00; 5.00; 5.00; 5.00; 5.50; 5.50; 8.00; 8.00; 4.00; ------------- RODCAM - Brisbane |

Posted By: RODCAM
Date Posted: 27 Mar 2008 at 9:20pm
|
After trying a couple of approaches to the coding, most of which were much more complex, the example below is the simplest method that illustrates the desired end result. The shortcoming with the example is that it uses the zig zag (peak) method so the step increments are not necessarily close to the target input step increment since the peaks can be much greater than the input step increment. Also, the latest peak on the plot can change because of the way the zig zag (peak) function works. The outcome I want is to use the first close or high that breaches the input step increment in either an up or down direction. Anyone got any ideas on a better way to code? [target =price]inc:= input("Step increment",5);pds := input("High periods",1);hhv (peak(1,C, inc),pds)------------- RODCAM - Brisbane |
 RODCAM
Posted By: maximo
Date Posted: 27 Mar 2008 at 9:44pm
|
Okay Rod, missing just one key ingredient, like a reference over what period? Is the requirement to use a Moving Average of this percentage over a number of bars? orrr Highest - Lowest of a period of days? which also determines when the line will go down instead of up. Here's a test indicator that shows daily percent range. As you can see its very choppy and needs a reference over a period of time like an Average or HHV. I used hist() to factor in any gaps between bars. {individual bar percent change} [color =blue]Bperc:=( H-L)/hist(L,1);Bperc; {highest bar percent in 8 bars} [color =lime green; linestyle=dotted]HHV (Bperc,8);{lowest bar percent in 8 bars} [color =red; linestyle=dotted]LLV (Bperc,8);
|
Posted By: maximo
Date Posted: 28 Mar 2008 at 12:42am
|
Ahhh now i see what you might be after.. Percentages vary from chart to chart too much to be effective on their own. So perhaps this support and resistance level indicator I wrote last month would be useful. It uses a moving average as it's reference point to switch the line up or down, depending if it closes above or below that average. You'l see it's very effective for breakouts up or down (breakdowns). {Support & Resistance } [Target =price]LookBack := Input("Look Back Periods",20,1);F:= input("Labels (1=On, 0=Off)",1,0,1);A:= input("Average (1=On, 0=Off)",1,0,1);Resistance := ValueWhen(1,Cross(ma(C,LookBack,S),C),HHV(H,LookBack+10));Support := ValueWhen(1,Cross(C,ma(C,LookBack,S)),LLV(L,LookBack+10));[color =blue]Resistance; [color =red]Support; [color =rgb(255,204,0)] {Gold}if (A,ma(C,LookBack,S),undefined);[linestyle =marker; marker=type2; name=Breakout]BO:= if(F AND C>Resistance AND hist(Close,1)<=Resistance,1,0);if (BO and hist(barssince(BO),1)>8,1,0);[linestyle =marker; marker=type1; name=Breakdown]BD:= if(F AND C<Support AND hist(Close,1)>=Support,1,0);if (BD and hist(barssince(BD),1)>8,1,0);
|
Posted By: blackdog
Date Posted: 28 Mar 2008 at 11:50am
|
Rodcam, I think the following code does what you want. [description ="plot the closing price in steps as it increases or decreases by a set input percentage, a bit like a Renko chart but shown as a line chart"][target =Price; author=zzz; category=zzz]steps := input("step percentage",10,0);blueline:= if (C*(1+steps/100)<=prev,C, if (C*(1-steps/100)>=prev, C,prev));[name ="blueline"; color=blue; width=2; linestyle=solid;]blueline; regards, BD
|
Posted By: RODCAM
Date Posted: 28 Mar 2008 at 6:11pm
|
Congratulations BD you get the cigar - at least on paper because after some other insights provided to me today I was able to code exactly what I was after before having read your post. (yeah..sure [target=price; author=Cameron, Rod; category=zzz] expr:= Expression("Expression",C);a:= input("Step %", 21, 0, 100);b:= a/100; base:= if(expr>=prev(expr)*(1+b), prev(expr)*(1+b), if(expr<=prev(expr)*(1-b), prev(expr)*(1-b), prev(expr)));base; upper:= base*(1+b); upper; lower:= base*(1-b); lower; [linestyle =fill; color=green]upper; base; [color =red]base; lower; I have not yet had a chance to check out the results of Maximo's coding but I will sometime over the weekend. As he correctly concluded my indicator is just another form or support & resistance, but I specifically wanted to use % since the fixed % steps allow you to visually roughly calculate profits or losses of price breakouts...everyone to their own! Thanks BD and Maximo.
------------- RODCAM - Brisbane |
 Rod
RodPosted By: maximo
Date Posted: 28 Mar 2008 at 11:33pm
|
Thanks blackdog always a help!
|
Posted By: blackdog
Date Posted: 03 Apr 2008 at 1:37pm
|
Rodcam,
It is very interesting to see the "minor differences" between your code and my code produce such large differenced in the graph. Your code limits the change to the step amount while in mine the step went to the new value of C when triggered.
I have been looking at it on CSL daily using 10% steps. Your code is much less succeptable to zigzagging than mine.
Very nicely done rodcam!
|
Posted By: RODCAM
Date Posted: 03 Apr 2008 at 4:30pm
|
BD, Thanks, another small incremental change in coding (below) makes it easier to visually pick up break outs, by just delaying the channel one period. I've played around a bit and the indicator is useful for not just break outs but also when prices are range bound. Some interesting results even on a stand alone basis when backtested with Tradesim... [author =Cameron, Rod][target =price]expr:= Expression("Expression",C);a:= input("Step %", 21, 0, 100);b:= a/100; base:= if(hist(expr,1)>=prev(expr)*(1+b), prev(hist(expr,1))*(1+b), if(hist(expr,1)<=prev(expr)*(1-b), prev(hist(expr,1))*(1-b), prev(expr)));upper:= base*(1+b); midup:= base*(1+b*0.618); middn:= base*(1-b*0.618); lower:= base*(1-b); [linestyle =solid; color=blue][name =Upper]upper; [name =Base]base; [name =Lower]lower; [linestyle =dotted; color=red][name =Midup]midup; [name =Middn]middn; [linestyle =fill; color=green][name =Top Fill]upper; base; [color =red][name =Bot Fill]base; lower;
------------- RODCAM - Brisbane |
Posted By: cmacdon
Date Posted: 10 Sep 2012 at 9:23pm
|
Here is a variation that is reasonably good for identifying coloured up and down trends by varying the step function [target=price; author=Cameron, Rod/BlackDog and
Maximo posts; category=zzz] expr:=
Expression("Expression",C); a:= input("Step
%", 3, 0, 100); b:= a/100; base:=
if(expr>=prev(expr)*(1+b), prev(expr)*(1+b), if(expr<=prev(expr)*(1-b), prev(expr)*(1-b), prev(expr))); [linestyle=dotted] base; upper:=
base*(1+b); upper; upper2:=
base*(1+(b/2)); upper2; Upper3:=
base*(1+(b*3/4)); Upper3; lower:=
base*(1-b); lower; lower2:=
base*(1-(b/2)); lower2; lower3:=
base*(1-(b*3/4)); lower3; [linestyle=fill; color=Red;] upper;
upper2; [color=White] upper2;
base; [color=Yellow] base;
lower2; [color=Blue] Lower2;
lower; [linestyle=pricecolor] [color=Lime Green] Close>base; [color=Red] Close<=base; [color=Blue] true; ------------- BC User since June 2007 |
Posted By: cmacdon
Date Posted: 16 Dec 2012 at 3:45pm
|
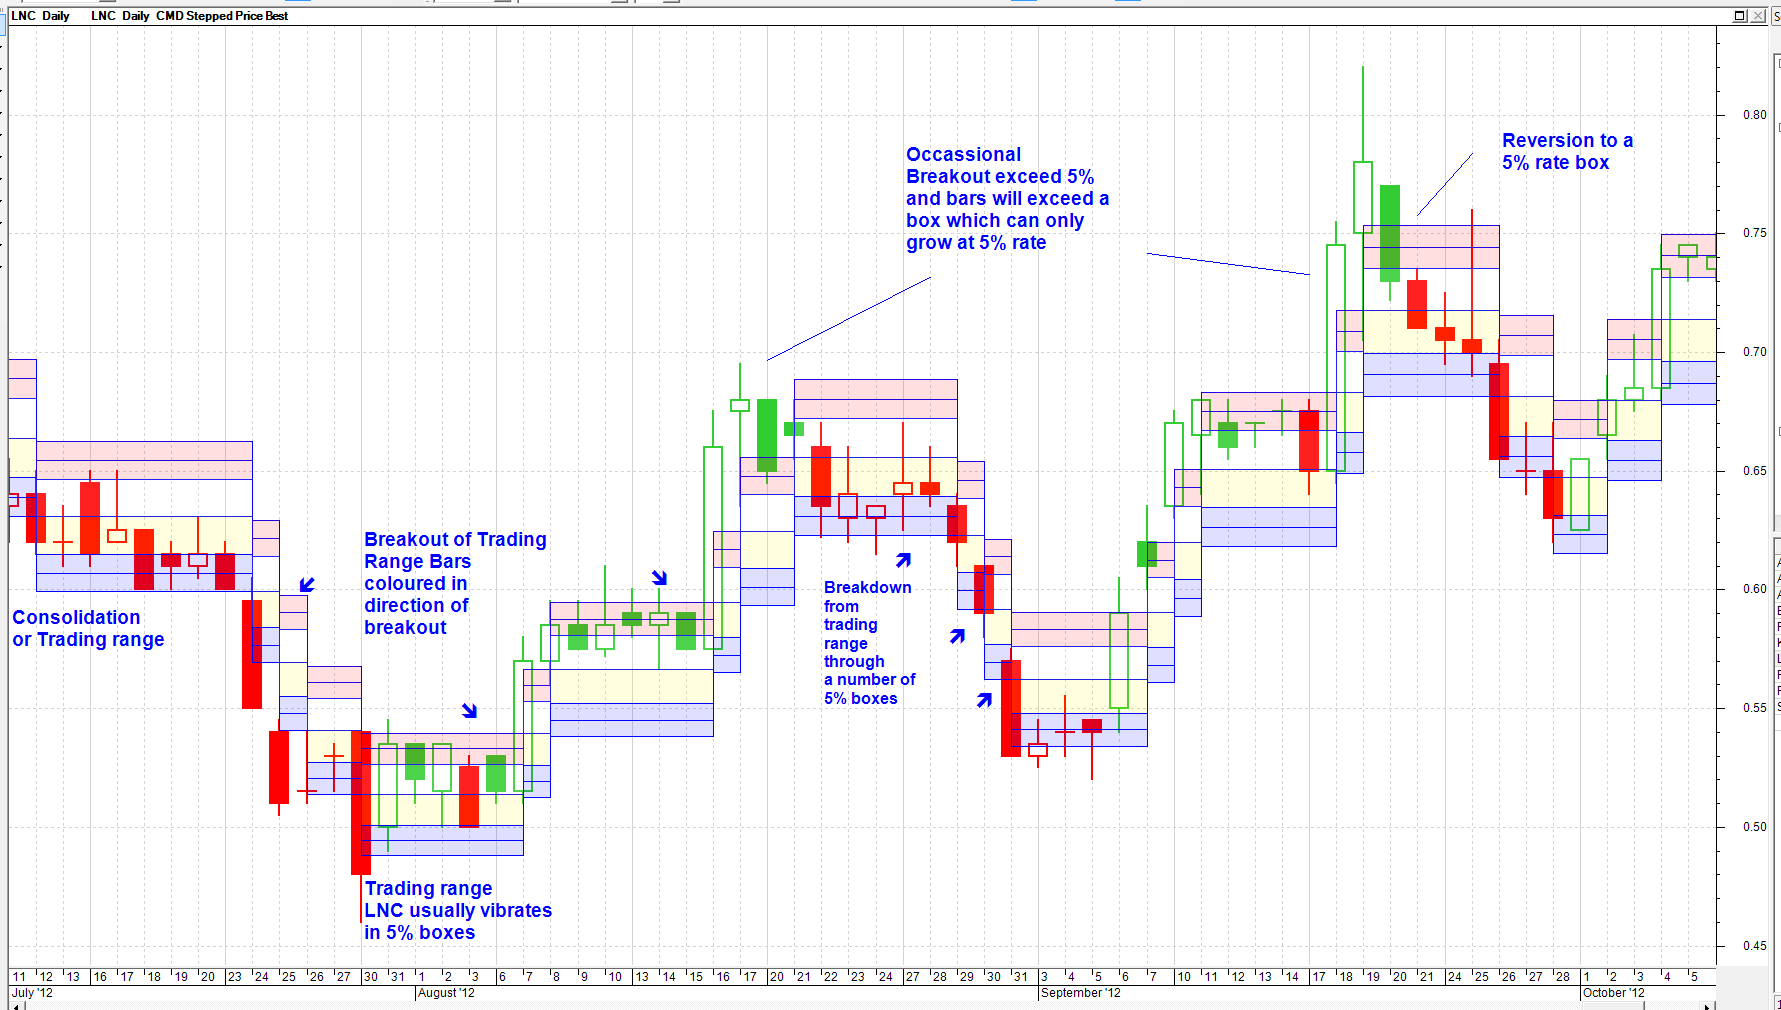
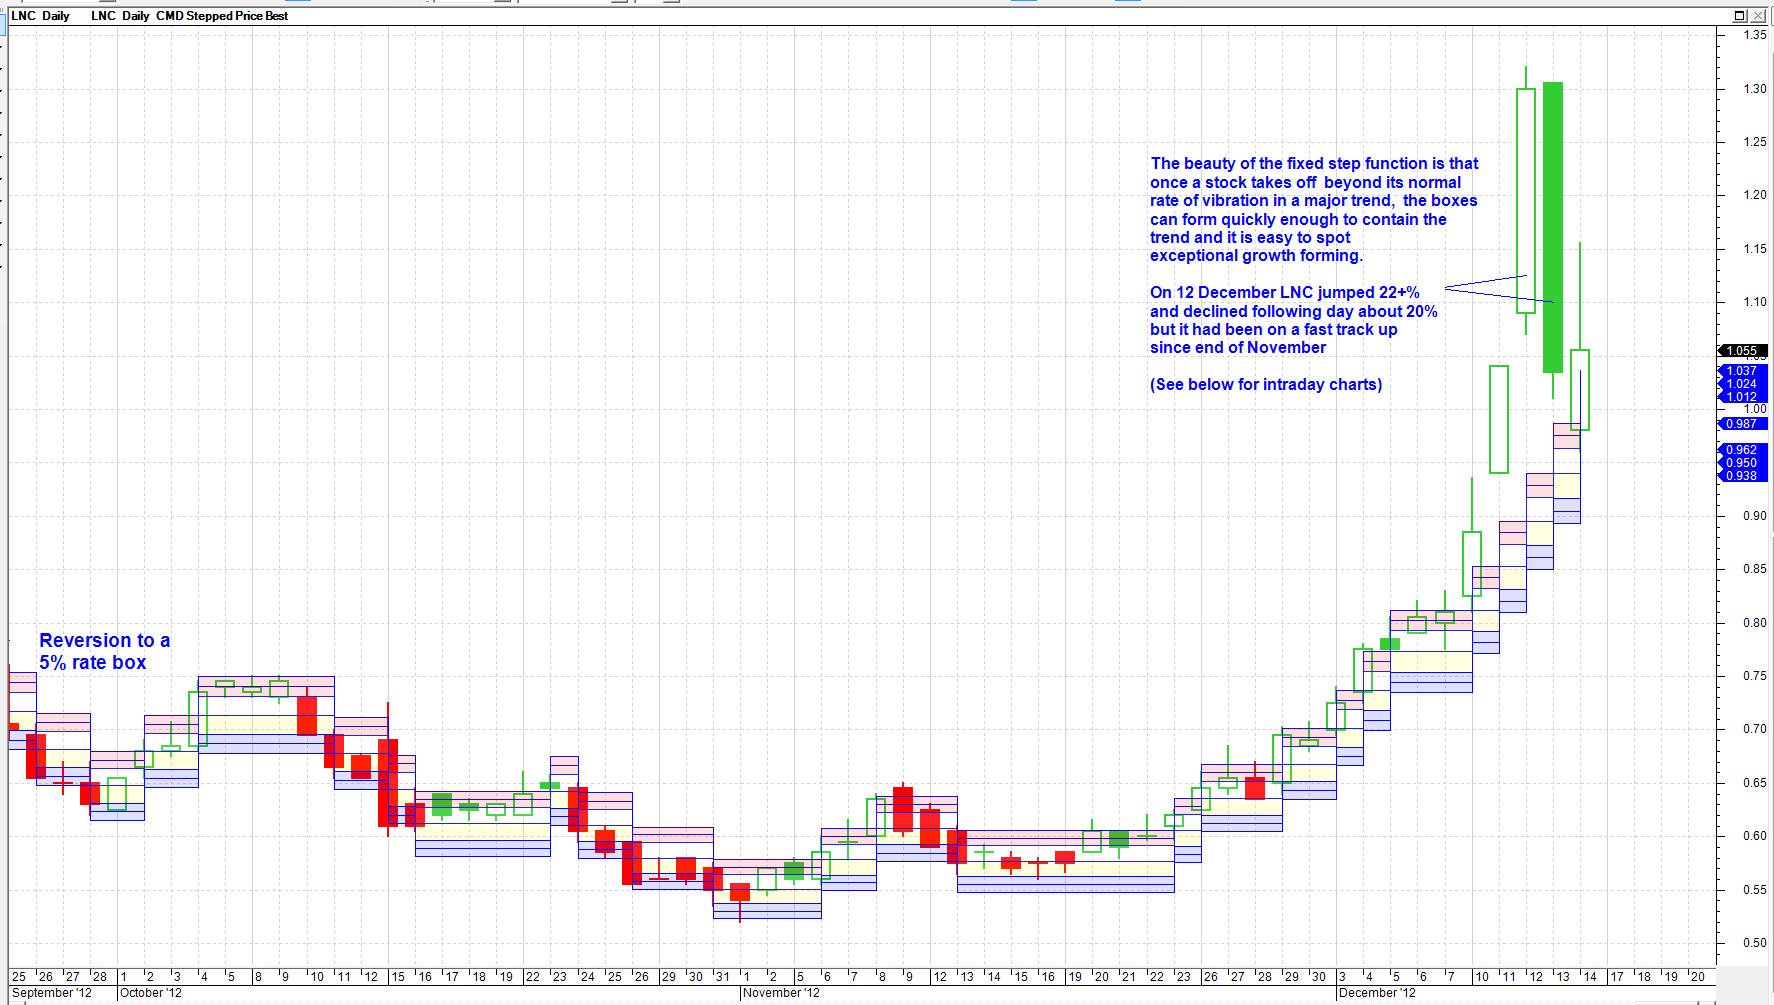
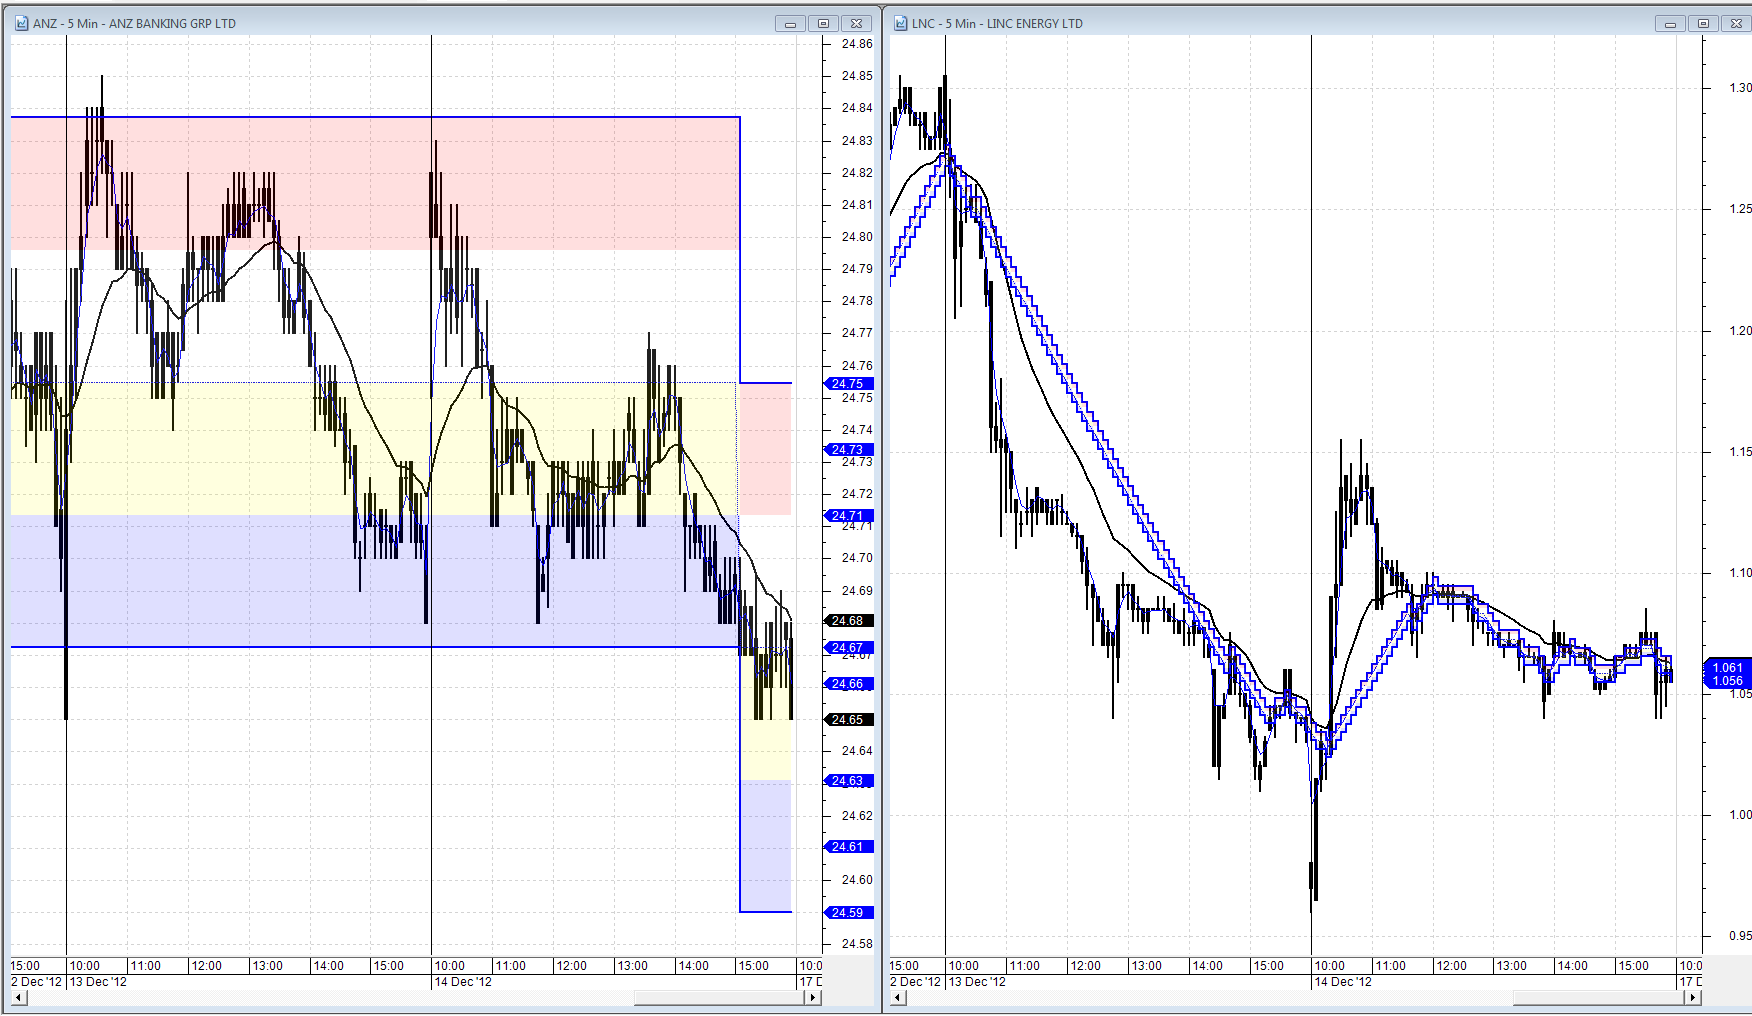
In response to a query by Charlie-B concerning the Joe Ross Concolidation I will post below perhaps a better way to monitor ranges and breakouts and how I use the adapted stepped price inidcator to scan for fast moving stocks on 5 to 15 minuute charts. Chart 1 is the daily showing the stepped price indicator with my adapted code previously posted on LNC using 5% boxes. The chart shows trading ranges and colours the bars if they are above or below the mid range of a box. Breakouts are easily seen. Chart 2 shows that if an exception trend occurs the fixed % boxes cannot form quickly enough as they are restricted to say in this case 5% per change and a stock might be tearing away abnormally at a much higher rate e.g LNC over last few days. However they will usually revert to there mean vibration so you can anticipate a change of direction. I code my watchlists into 2% to 8% per day Stepped Price Vibrations and most ASX stocks fit into one of these watchlists very well. Chart 3. Is a 5 Minute chart. So if I want to look at stocks moving at a a rate higher than 2% per day I set the vibration factor at 2%/60 for 5 minute charts as there are a 6 hours perr trading day = 0.0333%. A 15 minute chart scan would be set at 0.8333%. On chart 3 you see side by side a ANZ stock chart moving slowly at less than 2% per day from top of box to mid point, and the normal looking adapted stepped indicator box as a trading range. On the other hand in the right hand box is LNC on similar 5 minute chart but the stepped function is a series of small boxes that cannot contain the price trend. So I can know very early in a 5 or 15 minute chart that a scanned chart is looking like having a very good fast trending day beyond my target rate as distinct from bneing in a more sluggish a ranging day. The other thing you can do with this restriction on the rate at which boxes can form is work out Gann Style squaring of time targets into the future. Or work out rates of growth like Gann angles and if a stock is moving correctly the stepped price lines will form as straight lines at an angle from any point where price and time have come together. ------------- BC User since June 2007 |
Posted By: cmacdon
Date Posted: 16 Dec 2012 at 3:46pm
 ------------- BC User since June 2007 |
Posted By: cmacdon
Date Posted: 16 Dec 2012 at 3:47pm
 ------------- BC User since June 2007 |
Posted By: cmacdon
Date Posted: 16 Dec 2012 at 3:47pm
 ------------- BC User since June 2007 |