Ichimoku scan
Printed From: BullCharts Forum
Category: BullCharts
Forum Name: BullScan
Forum Discription: For discusssions on BullScan
URL: http://www.bullcharts.com.au/forum/forum_posts.asp?TID=1022
Printed Date: 20 Apr 2024 at 12:05am
Software Version: Web Wiz Forums 9.69 - http://www.webwizforums.com
Topic: Ichimoku scan
Posted By: dave1939
Subject: Ichimoku scan
Date Posted: 06 Mar 2018 at 8:16pm
|
anyone tried to code for a scan by Ichimoku? a strong buy signal is when the Tenkan Sen crosses from below the Kijun Sen above the Cloud (Kumo). The Kijun span being (highest high + lowest low) / 2 for the past 26 periods, unlike an EMA, can go flat for a period and thus shows support or resistance. Dave |
Replies:
Posted By: maximo
Date Posted: 06 Mar 2018 at 9:44pm
|
Here's the indicator:
{ name: Tenkan Sen & Kijun Sen } [Description="The Tenkan Sen and Kijun Sen are components of the Ichimoku Kinko Hyo Indicator."] [target=price] n1:= input("Tenkan Sen 'turning line'",9); n2:= input("Kijun Sen 'standard line'",26); [color=red] TS:=(HHV(H,n1) + LLV(L,n1)) / 2; TS; [color=blue] KS:=(HHV(H,n2) + LLV(L,n2)) / 2; KS; |
Posted By: maximo
Date Posted: 06 Mar 2018 at 10:03pm
|
The scan:
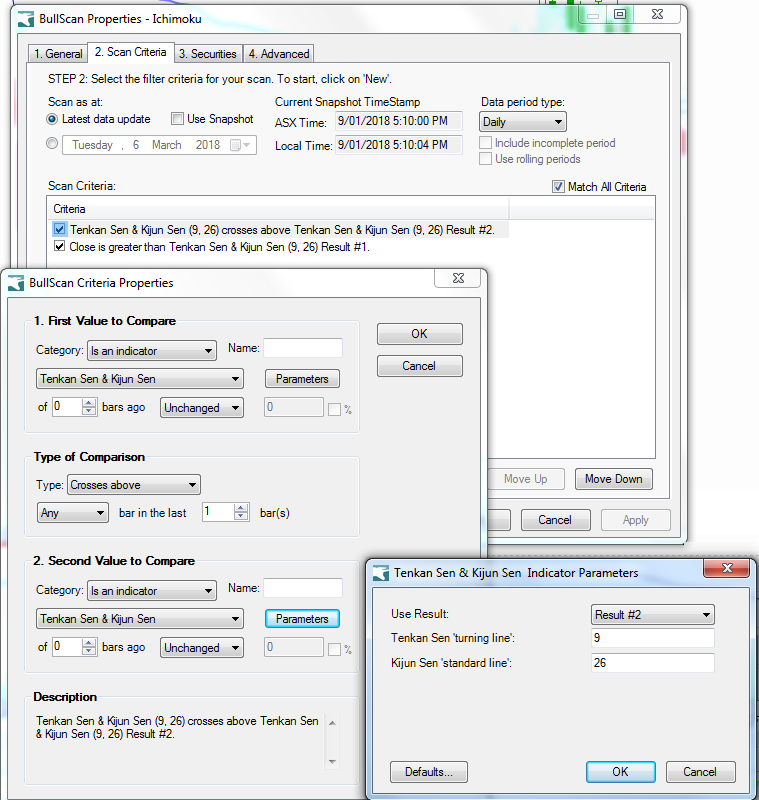
In Bullscan Manager select the 'new scan' icon. Name the scan Ichimoku or something similar. Right Click on the scan name you just created and then left click and select edit. Select 'New' to enter the following scan requirements. Tenkan Sen & Kijun Sen (9, 26) crosses above Tenkan Sen & Kijun Sen (9, 26) Result #2. Close is greater than Tenkan Sen & Kijun Sen (9, 26) Result #1. Today 6/03/2018 three came up in the scan. BIN RMD TNE 
|
Posted By: SayaPolo
Date Posted: 02 Dec 2018 at 6:10pm
|
Hi Maximo, thanks for the TK corssover scan. Can you can assist in creating scan for the Kumo Cloud break out (above or below) in BullChart? Observations shows that these break outs are great short term winners. Thanks.
|
Posted By: maximo
Date Posted: 02 Dec 2018 at 8:41pm
|
[Description="The Kumo (Cloud) are components of the Ichimoku Indicator"]
[target=price] TS:=(HHV(H,9) + LLV(L,9)) / 2; KS:=(HHV(H,26) + LLV(L,26)) / 2; SpanA:= hist((TS+KS)/2 ,26); SpanB:= hist((HHV(H,52) + LLV(L,52)) / 2 ,26); [name=Span Fill; linestyle=fill; color=blue] SpanA; SpanB; |
Posted By: SayaPolo
Date Posted: 03 Dec 2018 at 5:37am
|
Hi Maximo, Thanks so much for the prompt reply. I will now try to develop a trading plan with this scan. Cheers.
|
Posted By: dave1939
Date Posted: 05 Sep 2020 at 8:13pm
|
a simpler strategy is buy when price crosses above the Base Line and sell when price < Baseline or Lagging span close below Price. This was demonstrated on a recent Sydney ATAA webinar. I haven't coded it yet but it shouldn't be difficult. Dave
|