52 week High and 10% retracement level indicator
Printed From: BullCharts Forum
Category: BullCharts
Forum Name: BullScript
Forum Discription: Technical discussion related specifically to the BullScript programming language.
URL: http://www.bullcharts.com.au/forum/forum_posts.asp?TID=1019
Printed Date: 14 Jul 2026 at 11:05am
Software Version: Web Wiz Forums 9.69 - http://www.webwizforums.com
Topic: 52 week High and 10% retracement level indicator
Posted By: maximo
Subject: 52 week High and 10% retracement level indicator
Date Posted: 19 Feb 2018 at 12:33pm
|
Nicolas Darvas favoured stocks making 52 week highs.
From there he developed his Darvas box method to trade continuations of that established trend. So long as the price continued to break new highs he would stay in them. The indicator is made for daily charts. If you wish to use on the weekly chart, change the 252 to 52. [Description="Stocks making new highs make great trading prospects. The 10% retracement level is often a time to consider - Max"] {52 week High and 10% retracement level} [target=price] ColB:=HighestSince(1, (lastvalue(barnumber) - barnumber = 252) ,H); ColB; [color=lime green] 0.9*(ColB) 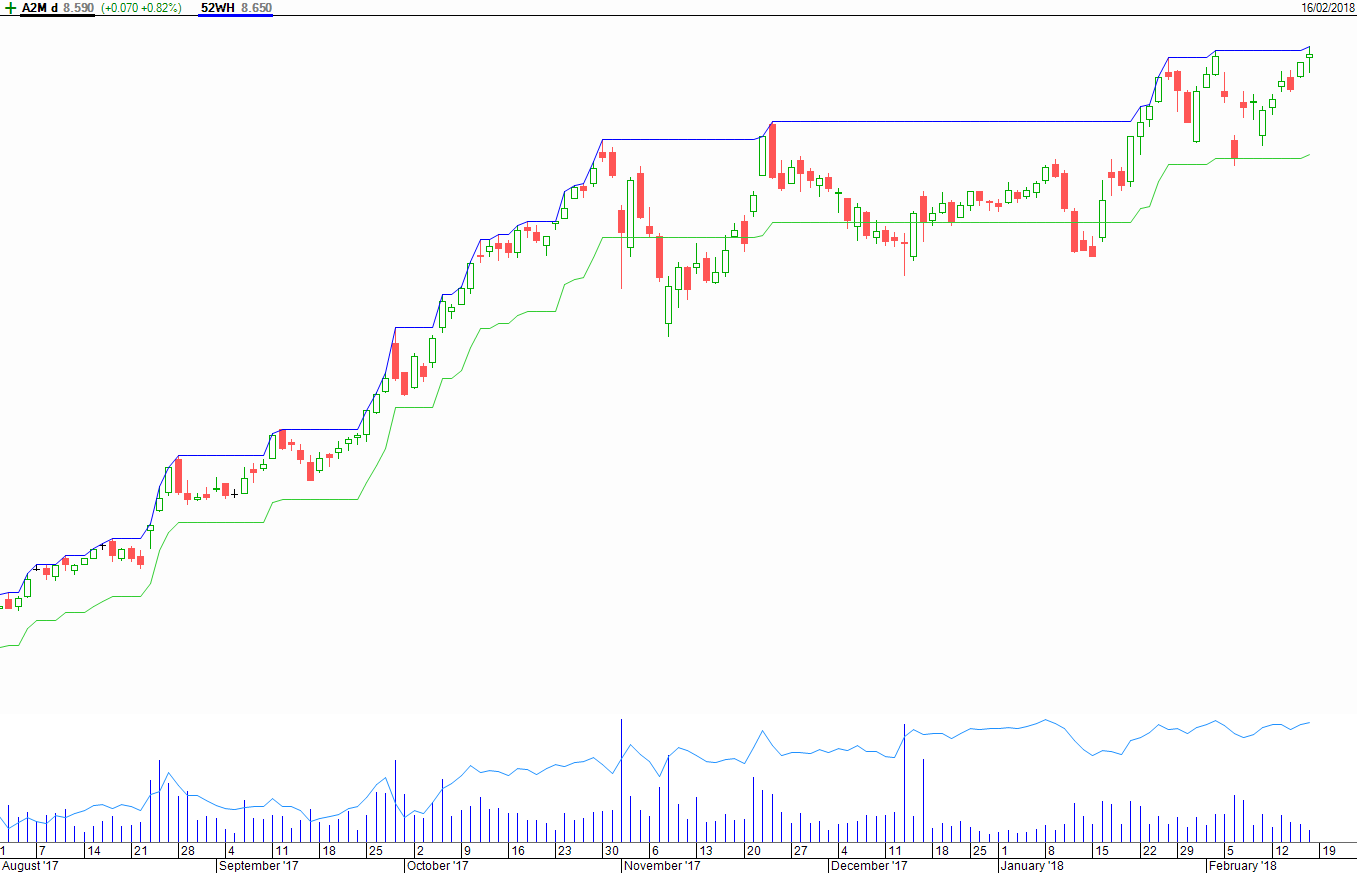
|
Replies:
Posted By: maximo
Date Posted: 26 Feb 2018 at 11:44pm
|
Update: Now indicator automatically switches timeframes from daily to weekly
{ Yearly High and 10% retracement level } [Description="Stocks making new highs make great trading prospects. The 10% retracement level is often a time to consider - Max"] [target=price] Nb:=Input("Number of Weeks",50,1); timeframe:= if(DayOfWeek(Now)=ref(DayOfWeek(Now),-1), Nb, Nb*5); ColB:=HighestSince(1,(lastvalue(barnumber) - barnumber = timeframe),H); ColB; [color=red] 0.9*(ColB) |
Posted By: Z2195067
Date Posted: 06 Jul 2020 at 12:09pm
|
Hi Maximo, Great formula re 52-week high and 10% retracement as potential stop-loss. I'm interested in furthering the 10% retracement, but changing the % value on condition of an index filter of the broader market, i.e. whether the index is bullish or bearish. What I mean , is that I would like to have the retracement line pick , say 60% when the index is above its moving average (bullish sentiment) and 10% when it is below its moving average (bearish sentiment). So the last line you have below "0.9*(ColB)" would evaluate into two different values based on an IF statement whether the index filter is bullish or whether it is bearish. Does this make sense? Wondering whether you would know how to implement this either via the "Formula" function or would you need to imbed the index filter logic inside an IF statement (if at all possible?). Cause I have only seen examples in Bullscript where the Formula function evaluates to only a single result..... Thanks Bouralex
|
Posted By: cudderbean
Date Posted: 08 Jul 2020 at 6:04pm
|
Perhaps I have misunderstood your question. Apologies if I have. Could you simply Input the retracement level manually, depending on your assessment of the bearish/bullish nature of the index. So, taking Maximo's coding, I have added a manual input, which you can adjust in the Parameters dialog box as you load the indicator... { Yearly High and 10% retracement level } [Description="Stocks making new highs make great trading prospects. The 10% retracement level is often a time to consider - Max"] [target=price] Nb:=Input("Number of Weeks",50,1); retrac:=Input("Retracement",.9,0); timeframe:= if(DayOfWeek(Now)=ref(DayOfWeek(Now),-1), Nb, Nb*5); ColB:=HighestSince(1,(lastvalue(barnumber) - barnumber = timeframe),H); ColB; [color=red] retrac*(ColB) There is possibly a way to make it run automatically linked to say the XJO that perhaps someone more skilled can code. I can see it may be handy to run it automatically for backtesting purposes.
|
Posted By: Z2195067
Date Posted: 09 Jul 2020 at 3:14pm
|
Hi cudderbean, Thanks for your reply. From what you suggest, there was still the need to develop an EITHER/OR logic with the creation of the "retrac" variable. Having said that, after this post, it got my brain juices going and I have made some considerable progress in formulating a stop-loss that varies based on the index filter sentiment. It's not complete and I'd like to ask someone a small favour who could make the last part of the code below work in a way that enables a user to drag the date of the trend on the chart left and right and the stop loss indicator updates dynamically , cause at the moment it is static at 52 bars. Any further assistance would be greatly appreciated. Please note I have some of my own notes in { } that can be ignored for these purposes. An example of CDA is attached below. Try it out and let me know if you can see anything I can do to streamline it. *** [Target=Price; category=Stop Loss]; {Define the date of the trend} TDate:=InputDate("Date of trend", date(2020,01,01)); {Define the stop-loss retracement percentages} Value1:=input("Retracement Bullish %",0.6,0); Value2:=input("Retracement Bearish %",0.9,0); {Defines the variables for exponential moving average and index filter} expr := Expression("Expression",Close); method := inputma("Method",Exponential); n := input("Time periods",10,1); symb := inputsymbol("Compare to", "XAO"); P:=LoadSymbol(symb,expr); {Evaluate Bullish sentiment} [color=Lime Green; name=Bullish] SignalAbove:=ref(P,1)>ref(MA(P,n,method),1); {SignalAbove;} {Evaluate Bearish sentiment}{possibly redundant section?} [color=Red; name=Bearish] SignalBelow:=ref(P,1)<ref(MA(P,n,method),1); {SignalBelow;} HoldingDays:=BarsSince(OnOrSkipped(TDate)); {Determines the highest prominent high over the last 52 weeks} {NOTE:>>>>> I want to link the number of bars to the HoldingDays variable, not 52 weeks} [color=Blue; linestyle=Dotted ; name=Highest Prominent High] Stop:=HighestSince(1, (lastvalue(barnumber) - barnumber = 52) ,H); {could this be replaced with HoldingDays variable?} Stop; [color=Red; linestyle=Horz step; name=Retracement % Stop] ValueB := If(Stop>PREV(undefined) AND ref(P,1)>ref(MA(P,n,method),1),Stop*Value1,Stop*Value2); {If(Stop<=PREV(undefined),PREV(undefined),Stop*Holdingdays));NOTE:>>>>>
I haven't figured out what to do with the rest of this nested IF
statement as it was inherited from a previous Bullscript file, possibly
redundant now!} If(ValueB = 0, undefined, ValueB); 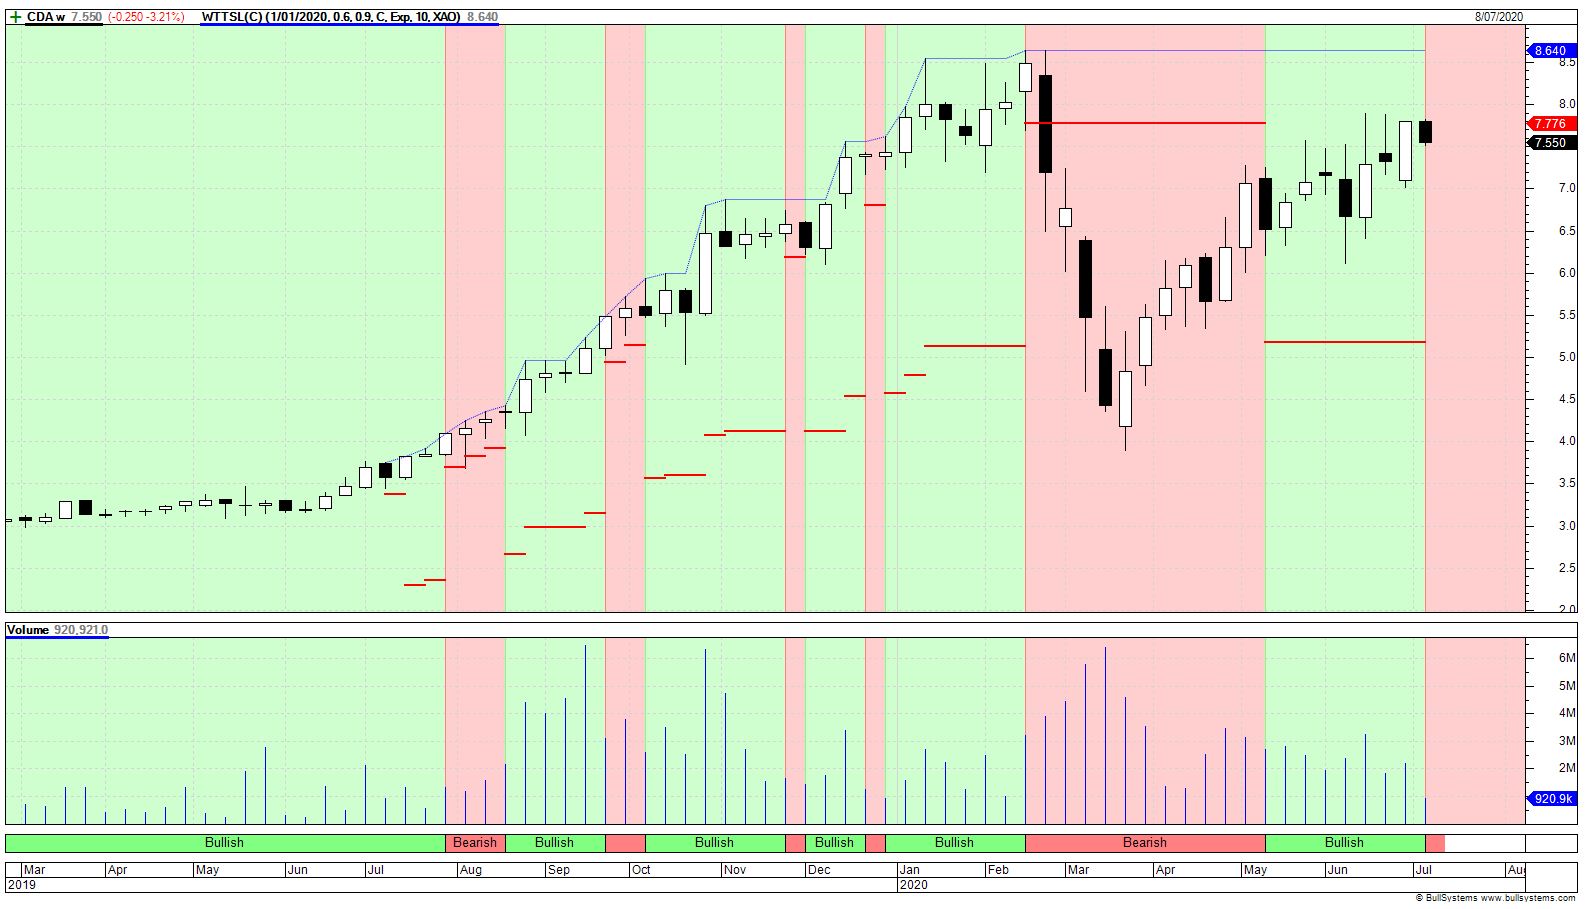 |
Posted By: cudderbean
Date Posted: 09 Jul 2020 at 10:56pm
|
I am away for a week tomorrow (busy at the moment) and I'm afraid also I'm not that good a coder to be able to help you. But I will have a look when I return. I can see the merit of linking your varying stop loss to Index sentiment. And of course anything automatic is much preferable to tedious manual insertion. Maybe someone more skilled could help. Good luck.
|