Coloring of an indicator
Printed From: BullCharts Forum
Category: BullCharts
Forum Name: BullScript
Forum Discription: Technical discussion related specifically to the BullScript programming language.
URL: http://www.bullcharts.com.au/forum/forum_posts.asp?TID=1015
Printed Date: 04 May 2024 at 5:09pm
Software Version: Web Wiz Forums 9.69 - http://www.webwizforums.com
Topic: Coloring of an indicator
Posted By: stefanols
Subject: Coloring of an indicator
Date Posted: 27 Nov 2017 at 4:19pm
|
Anyone? The other instrument can be anything AAPL etc. I am just after hot to color the result. I am trying to make an indicator easier to read. However it does not turn out as I would like. I would like to have plot in green when above 65, red below 35 and the rest in black. Hope that someone can assist. Thanks in advance BR Stefan [target=Default;Horzline=80,15] [tooltip= CPI Bulkowski, "36-64 Neutral, 65-100 Bullish, 1-35 Bearish,1-35"] {Calculate the realtion between bullish and bearish CPI count} symb := inputsymbol("Security","AAPL"); otherClose := LoadSymbol(symb, Close); total := close+otherclose; CPI :=(close)/total*100; CPIBU := if(CPI >= 65,CPI,undefined); CPIBE := if(CPI < 36,CPI,undefined); CPINE := if(CPI >36 or CPI>65,CPI,undefined); [linestyle=Line; width=2; color=green] CPIBU; [linestyle=Line; width=2; color=red] CPIBE; [linestyle=Line; width=2; color=black] CPINE; |
Replies:
Posted By: maximo
Date Posted: 11 Jan 2018 at 10:04pm
|
An RSI(2) works as well as Bulkowski's CPI indicator on an index.
The idea is to Buy above the green line only when coming from the opposite red side. It has a 66% probability of closing in the positive for the following day only. [Description="RSI with CPI Bulkowski parameters"] n := input("Time period",2,1); nb:= n*2-1; {=wilder's smoothing } Su:=Ma(If(C-Ref(C,-1) > 0, C-Ref(C,-1), 0),nb,E); Sd:=Ma(If(C-Ref(C,-1) < 0, Ref(C,-1) - C, 0),nb,E); rs:=100-100/(1 + (Su/sd)); rs; rs1:=if(rs>=65,rs,65); rs2:=65; rs3:=if(rs<=36,rs,36); rs4:=36; [color=lime green; linestyle=dotted] 65; [color=red] 36; [name=RSI Top Fill; linestyle=fill; color=blue] rs1; rs2; [name=RSI Low Fill; linestyle=fill; color=blue] rs3; rs4; 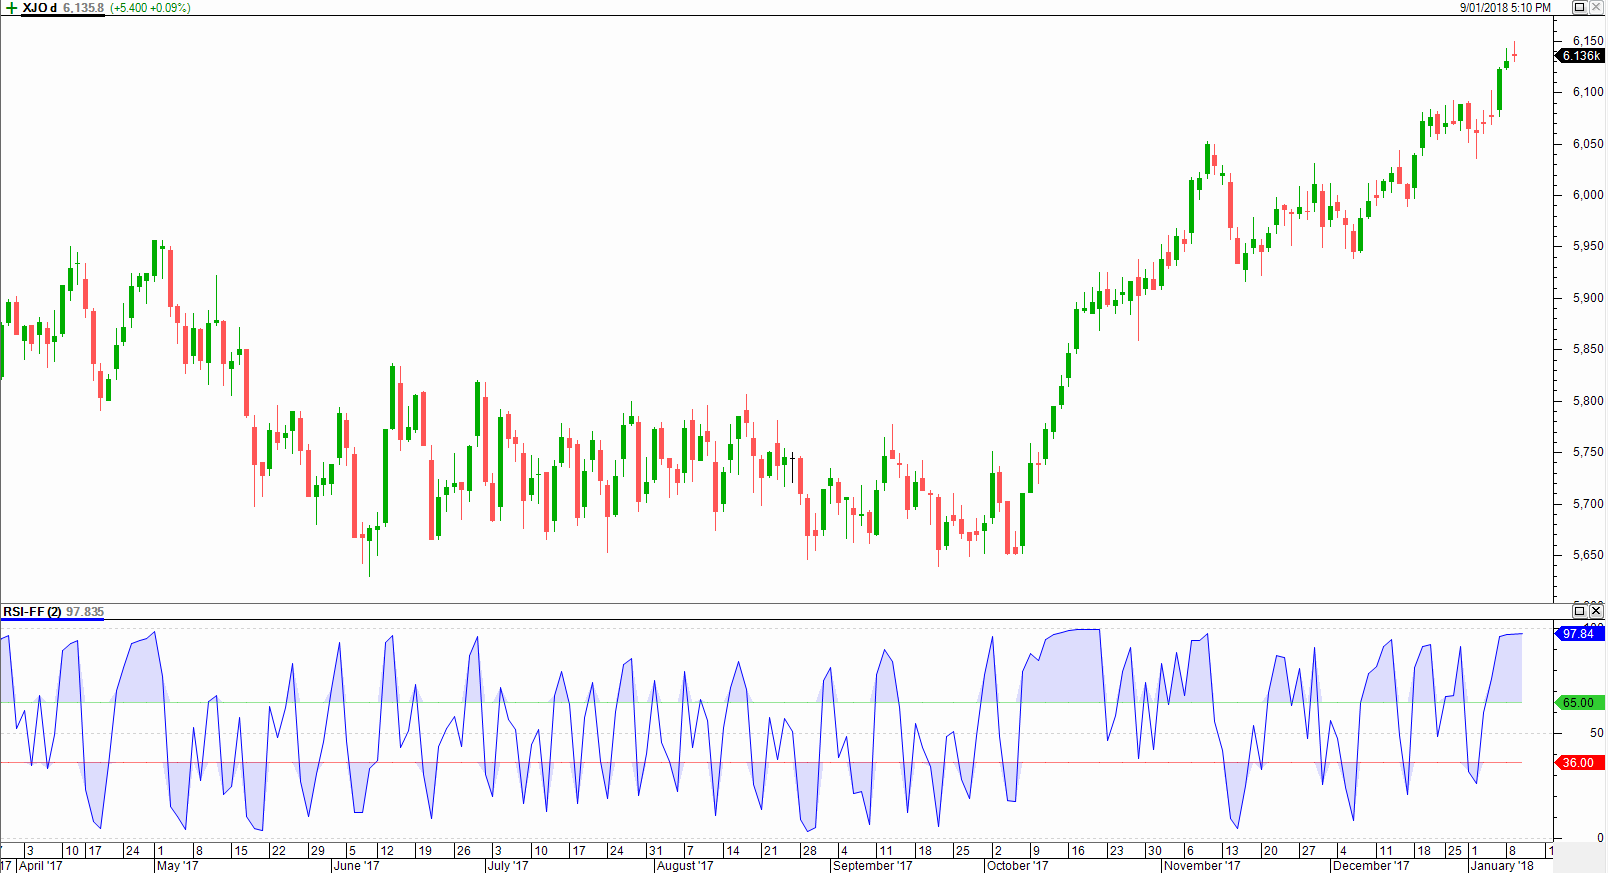
|
Posted By: stefanols
Date Posted: 14 Jan 2018 at 2:43pm
|
The visualisation was just what I was looking for. |