% profit taker
Printed From: BullCharts Forum
Category: BullCharts
Forum Name: BullScript
Forum Discription: Technical discussion related specifically to the BullScript programming language.
URL: http://www.bullcharts.com.au/forum/forum_posts.asp?TID=1007
Printed Date: 05 May 2024 at 5:10am
Software Version: Web Wiz Forums 9.69 - http://www.webwizforums.com
Topic: % profit taker
Posted By: jalna
Subject: % profit taker
Date Posted: 04 Sep 2016 at 1:22pm
|
Hi, Is there and indicator that can be set as a % profit taker that can be trailed above the open of the day or set once you have put on a trade. Hopefully there is something that can be written so I don't have to keep drawing it on myself
|
Replies:
Posted By: cmacdon
Date Posted: 21 Sep 2016 at 10:32am
|
Jalna Can you define your understanding of a % profit taker i.e. how would the indicator know your previous buy price? I assume the formula you are interested in is along the lines the open (after a market opens) less the as yet undefined buy price?
Would it not be better the Close less a buy price as in the morning before a market opens all the indicator can identify is the close of the day before? cmacdon
------------- BC User since June 2007 |
Posted By: jalna
Date Posted: 26 Sep 2016 at 11:39am
|
Hi I'm thinking- buy around end of day and to take some profit
at around 5% which seems feasible in this choppy market. So end of previous day plus 5% |
Posted By: cmacdon
Date Posted: 26 Sep 2016 at 3:37pm
|
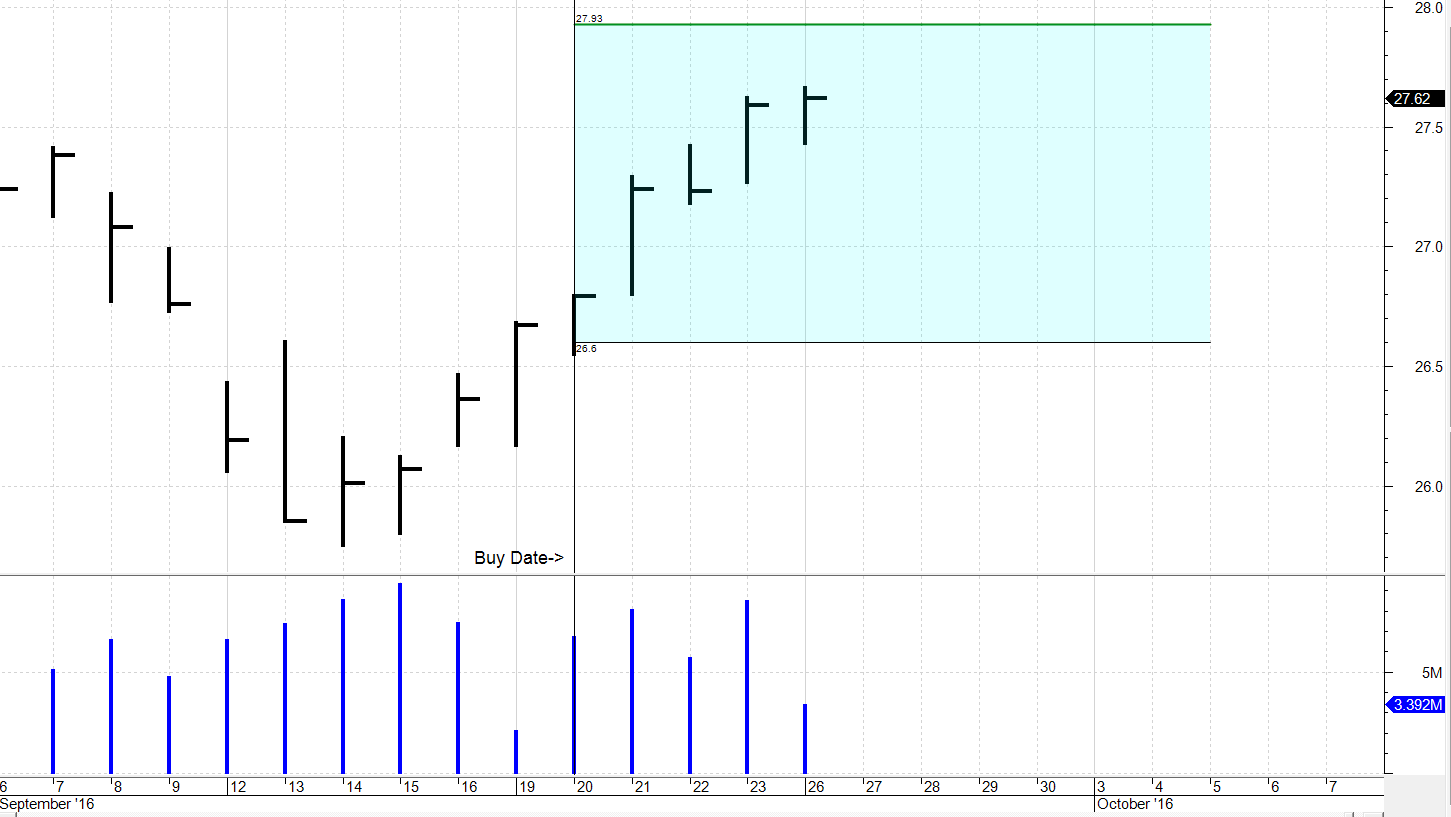
Jalna Here is an indicator that should do the trick, it is more flexible than you requested. You can enter any purchase price, and any nominated profit % for the the nominated starting date in the settings. Once set and the indicator is showing on a chart, you can click on the indicator on the chart and, then, you can slide the indicator backwards or forwards to a different starting position - then, re-enter a new purchase price for the revised starting date in the settings. The indicator uses a great new feature that is to be available in the next BC update as shown in the second top line. What this code function does, is allow an indicator code, that does not depend on the last traded bar, to be extended into the future i.e the space to the right, in this example 20 bars beyond the last traded bar. So you can monitor how a future trade is developing against any overlay whether is a geometric structure or an predefined angle or a profit target as shown in this example. The new feature was provided by Brendon and Day at BC - so thanks to them. As you probably do not have the new BC update yet, although it may be due for release soon. You might have to delete from the second line below the "extend_to_right=20" wording; - in which case the indicator should then work OK but only up to the last traded bar. The code is below - I tested it on ANZ hence the nominated start date and starting price. I will post an image for the indicator on ANZ separately. [citation="% Profit target indicator"; Author =cmacdon] [extend_to_right=20; Target=Price;] TDate:=InputDate("Start Date", date(2016,9,20)); Hd:=BarsSince(OnOrSkipped(TDate)); pt:=input("% Profit target", 5, 1, 100); Bought:=input("Input purchase price", 26.6, 0.01, 100); pd:=input("Bars to be monitored", 10, 1, 1000); [name=Buy Level; linestyle=Horzline; Width=1; color=Black;] Buy:=if( HD<=pd+1,valuewhen(Hd=0,Bought),undefined); Buy; [name=Target; linestyle=Horzline; Width=2; color=Green;] Target:=if(HD<=pd+1,valuewhen(Hd=0,Bought*(1+(pt/100))),undefined); Target; [name=Profit Target Fill; linestyle=Fill] [color=Cyan] Buy; [color= Cyan] Target; [name=Buy Date->; linestyle=verticalmarker;Market=Long; Width=1; color=Black;] If(HD=0,Bought*0.90,undefined); [ Linestyle=Text; fontsize=6; textalign=Below,left ]
if(valuewhen(1,HD=0), Round(Buy,2) + " " ,undefined);Buy; [textalign=Above,left; ] if(valuewhen(1,HD=0), Round(Target,2) + " " ,undefined);Target; ------------- BC User since June 2007 |
Posted By: cmacdon
Date Posted: 26 Sep 2016 at 3:41pm
------------- BC User since June 2007 |
Posted By: jalna
Date Posted: 30 Oct 2016 at 12:12pm
| Thankyou for that. Its looking very useful. I have a problem though in that I put the indicator on with just the prices (no cyan infill) and can't find an area to click on it to delete it and its on all my other charts which is making them squashed down. I tried deleting the indicator but its still on my chart |
Posted By: jalna
Date Posted: 30 Oct 2016 at 12:17pm
| oh its ok I closed the work space and it disappeared now. :) Ill upload it and try again :) thanks |