David Weis’s Weis Wave |
Post Reply 
|
Page <12 |
| Author |
 Printable Version Printable Version Delicious Delicious Digg Digg Facebook Facebook Furl Furl Google Boomarks Google Boomarks Google Buzz Google Buzz MySpace MySpace Newsvine Newsvine reddit reddit StumbleUpon Translate StumbleUpon Translate Twitter Twitter Windows Live Windows Live Yahoo Bookmarks Yahoo Bookmarks Topic Search Topic Search  Topic Options Topic Options
|
cmacdon 
BullCharts Guru 
Joined: 09 Sep 2012 Location: Brisbane Posts: 236 |
 Post Options Post Options
 Quote Reply Quote Reply
 Posted: 01 Sep 2015 at 9:59am Posted: 01 Sep 2015 at 9:59am |
|
The horizontal bar below in the bottom panel reflects to last volume wave height from the right edge. To see the Total volume on any wave in the bottom panel hover the mouse cursor over the last bar on the volume wave. 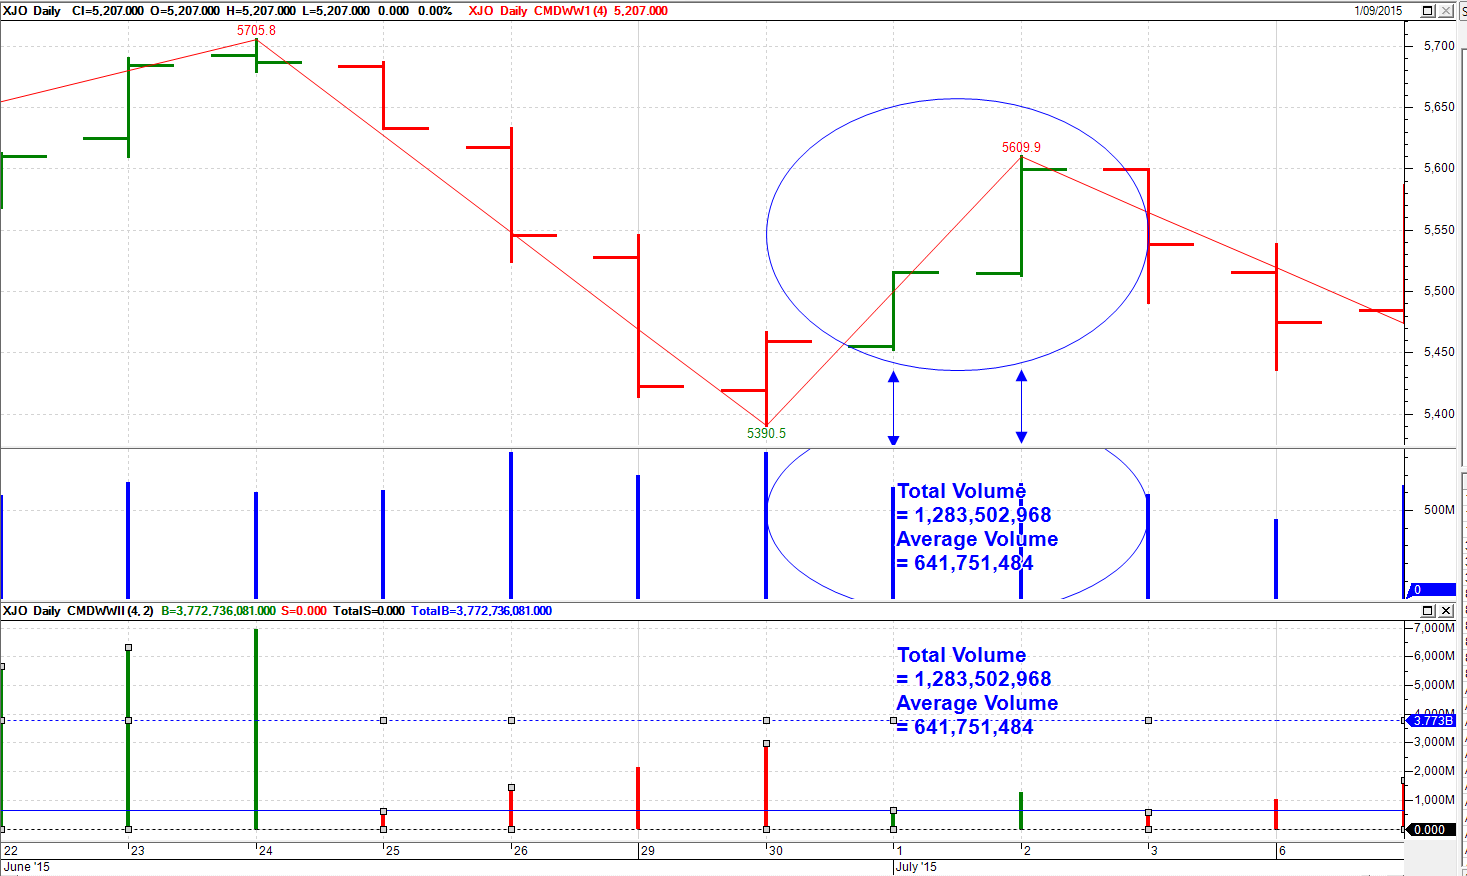 Edited by cmacdon - 01 Sep 2015 at 10:07am |
|
|
BC User since June 2007
|
|
 |
|
|
cmacdon
BullCharts Guru
Joined: 09 Sep 2012 Location: Brisbane Posts: 236 |
Post Options
Quote Reply
Posted: 01 Sep 2015 at 10:03am |
|
Using the Average Vol wave the Hovering mouse option does not work in BC so draw a horizontal line to read the average volume on the right hand scale. 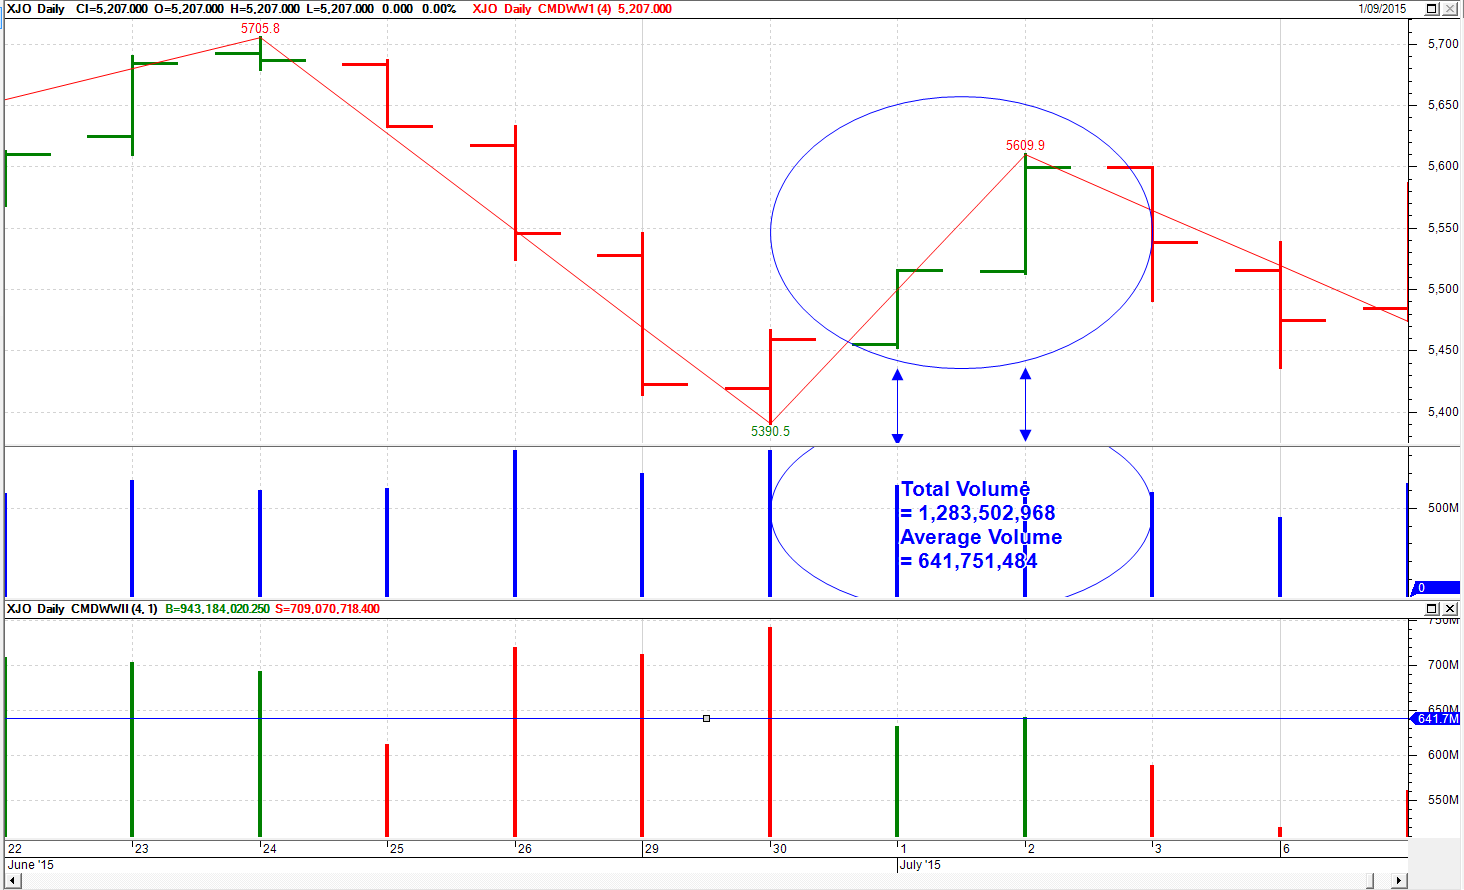 Edited by cmacdon - 01 Sep 2015 at 10:09am |
|
|
BC User since June 2007
|
|
|
|
|
todbull
Newbie 

Joined: 20 Jan 2015 Location: Australia Posts: 3 |
Post Options
Quote Reply
Posted: 01 Sep 2015 at 11:54am |
|
Charles,
Sorry for my ignorance about the volume statement. Only last night watching the video, I must have picked up something out of context, regards his Weis wave video, with my little knowledge of the subject.
Ordered his book yesterday and I would certainly be buying your book. Where can one find about buying your book/indicators when it is released? |
|
|
|
|
cmacdon
BullCharts Guru
Joined: 09 Sep 2012 Location: Brisbane Posts: 236 |
Post Options
Quote Reply
Posted: 01 Sep 2015 at 3:07pm |
|
TodBull We all have to learn. From my intro. Charles "Knowledge is more powerful than gold.”...
"Never think that you know it all. I have been studying Stocks and
Commodities for forty years, and I do not know it all yet. I expect to continue to learn something every
year as long as I live,”[1] … "remember you can never have too much
knowledge. Continue to study and learn
more for knowledge can always be turned into profits later."[2]
|
|
|
BC User since June 2007
|
|
|
|
|
paulchow2k
Newbie
Joined: 15 Oct 2010 Posts: 7 |
Post Options
Quote Reply
Posted: 21 Feb 2016 at 4:13pm |
|
Its getting harder to use VSA nowadays as Bullcharts doesn't quite show ALL the volume of a security just yet. Perhaps later versions will. P
|
|
|
|
|
cmacdon
BullCharts Guru
Joined: 09 Sep 2012 Location: Brisbane Posts: 236 |
Post Options
Quote Reply
Posted: 21 Feb 2016 at 11:50pm |
|
Paul I am not sure what exactly is the problem you are finding with the BC Volume by the end of day. What are you comparing the BC volume to? I know that e-signal does not post the correct EOD volume until the opening of the next day and that has always been an issue for the tradeguider people using EOD prices but the delayed volume is not out until the next morning but they do not always run TG with e-signal data feedsas they have several platorms they can run on which do not need e-signal. Intraday there should be no difference as the volume data is not waiting for an exchanges to confirm the total volume data for the day. Even the ASX volume is not confirmed until after 7.00 when BC does it's final update. Regards Charles
|
|
|
BC User since June 2007
|
|
|
|
|
rbbrain
BullCharts Staff 

Joined: 22 Jul 2006 Location: Melbourne Posts: 168 |
Post Options
Quote Reply
Posted: 24 Feb 2016 at 2:26pm |
|
Hi paulchow2k, and all,
The BC data only shows the volumes transacted on the ASX exchange. Knowing that our second exchange operator in Australia (Chi-X) now handles about 20 percent of the daily volume (across something like 50?? stocks), we know that the BC volumes will be lower than total volume for some stocks. See the Chi-X web site for details: http://au.chi-x.com/ |
|
|
Convenor - Australian BullCharts User Group Brainy's Share Market Toolbox and BullCharts Tips [/CENTER |
|
|
|
|
Post Reply
|
Page <12 |
| Forum Jump | Forum Permissions You cannot post new topics in this forum You cannot reply to topics in this forum You cannot delete your posts in this forum You cannot edit your posts in this forum You cannot create polls in this forum You cannot vote in polls in this forum |


