Basic Gann Square Bullscript |
Post Reply 
|
| Author |
 Printable Version Printable Version Delicious Delicious Digg Digg Facebook Facebook Furl Furl Google Boomarks Google Boomarks Google Buzz Google Buzz MySpace MySpace Newsvine Newsvine reddit reddit StumbleUpon Translate StumbleUpon Translate Twitter Twitter Windows Live Windows Live Yahoo Bookmarks Yahoo Bookmarks Topic Search Topic Search  Topic Options Topic Options
|
cmacdon 
BullCharts Guru 
Joined: 09 Sep 2012 Location: Brisbane Posts: 236 |
 Post Options Post Options
 Quote Reply Quote Reply
 Topic: Basic Gann Square Bullscript Topic: Basic Gann Square BullscriptPosted: 11 Oct 2014 at 8:55am |
|
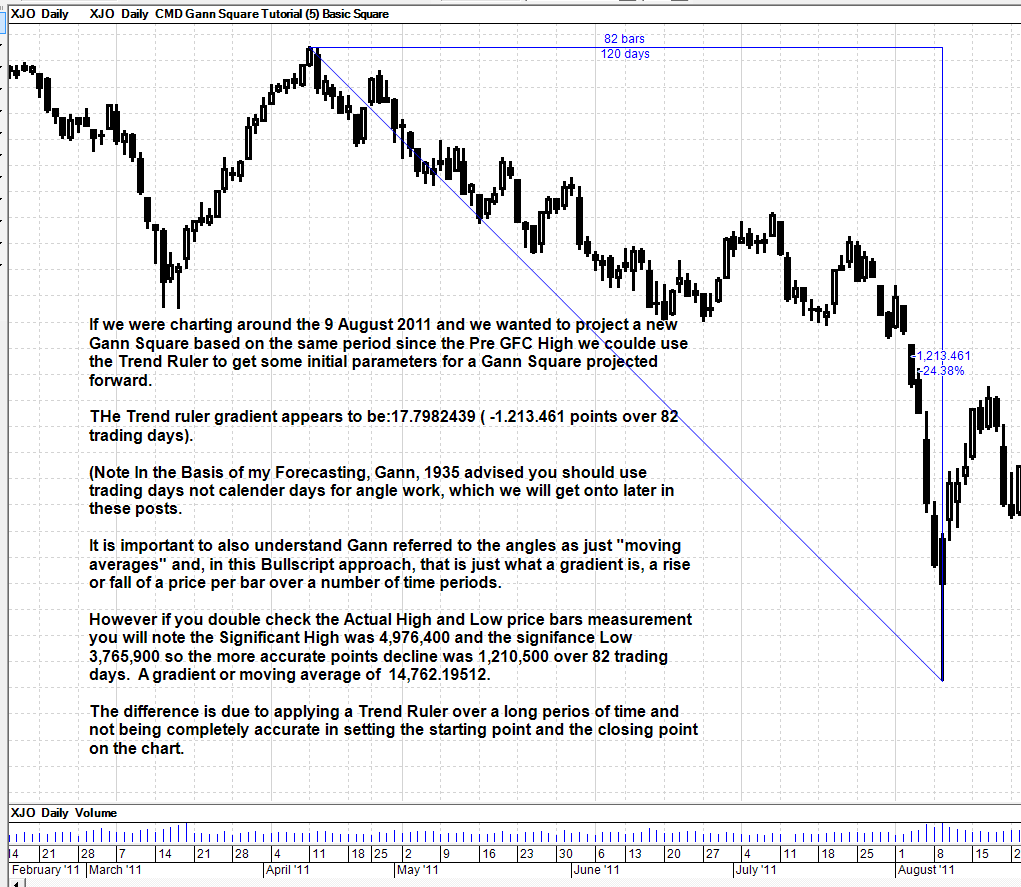
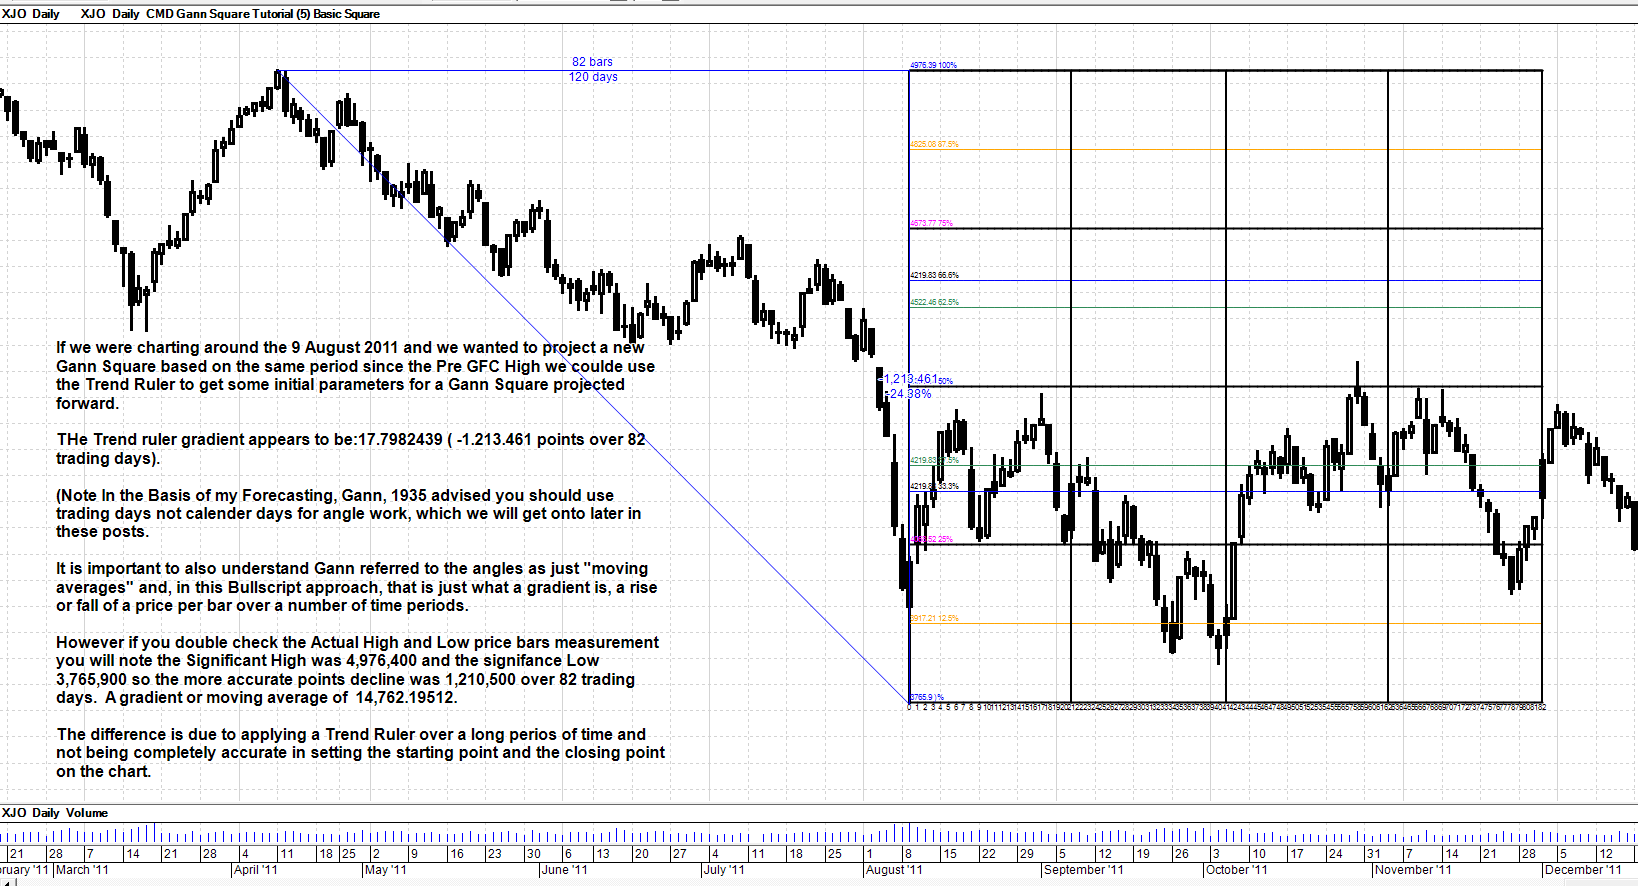
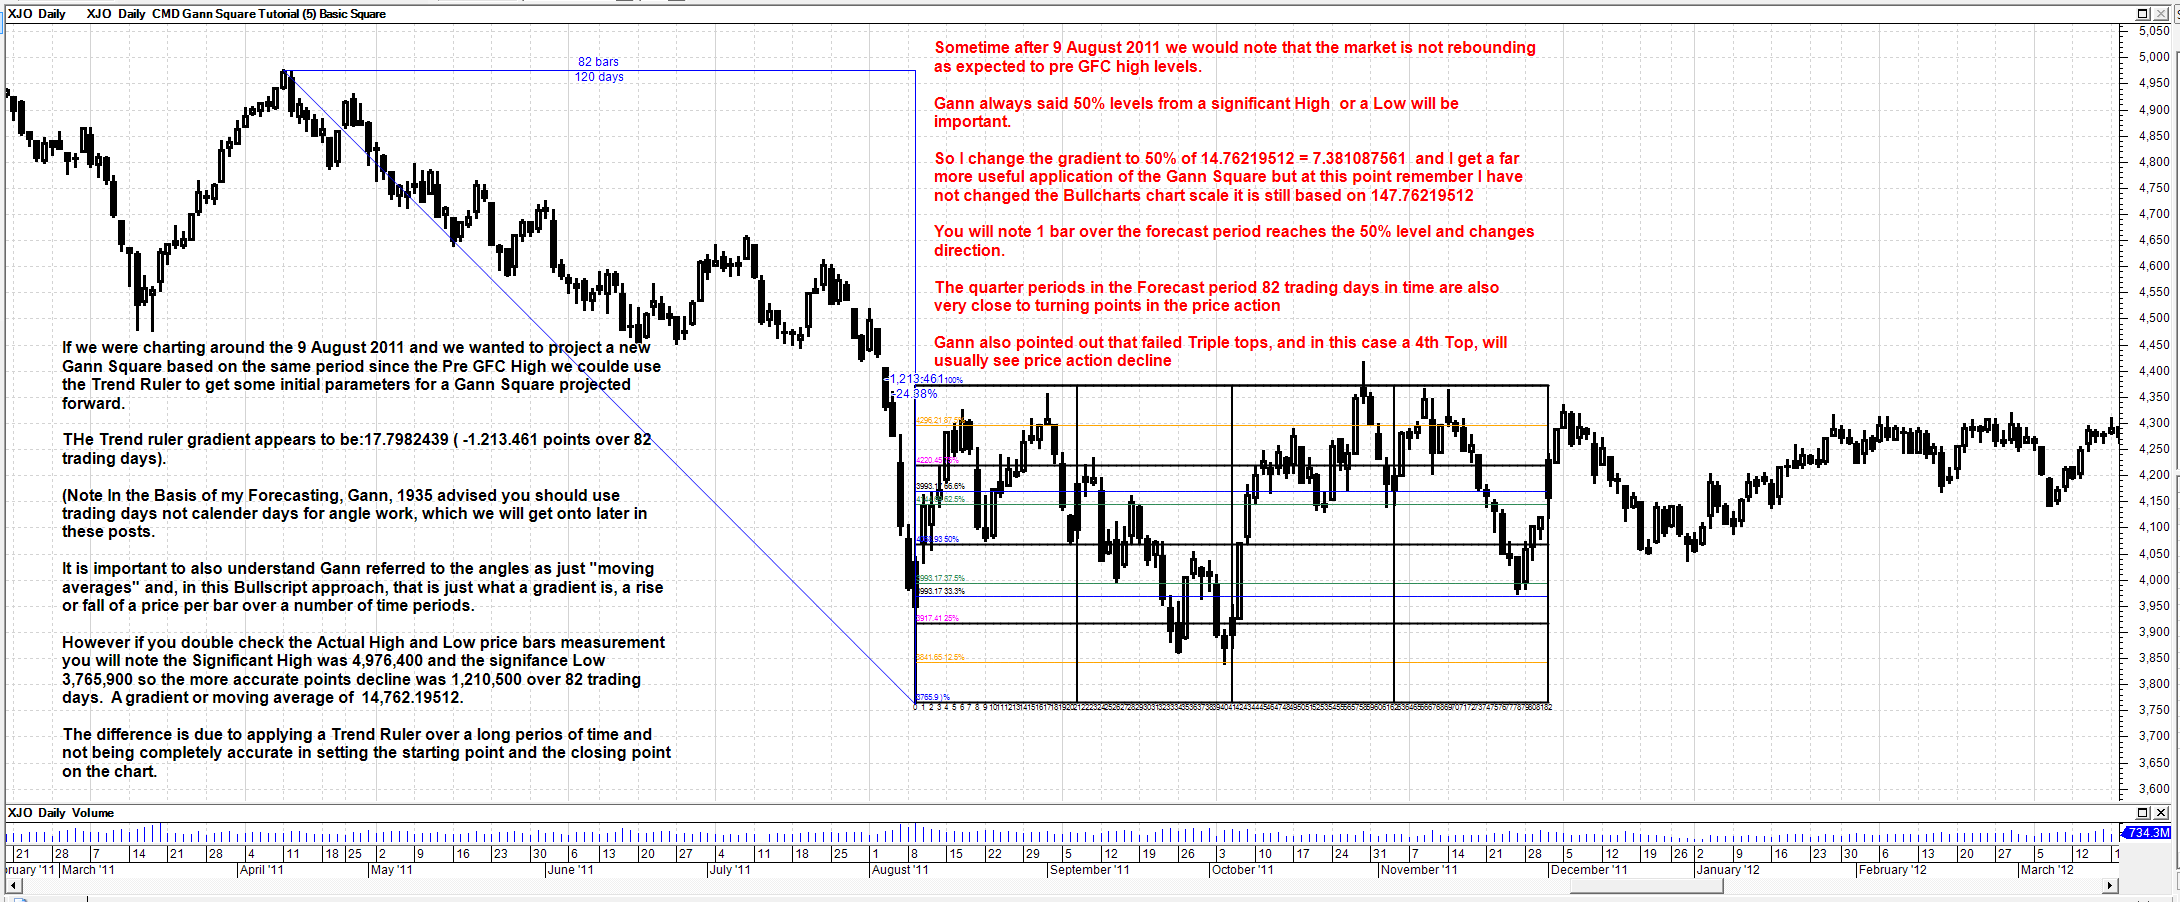
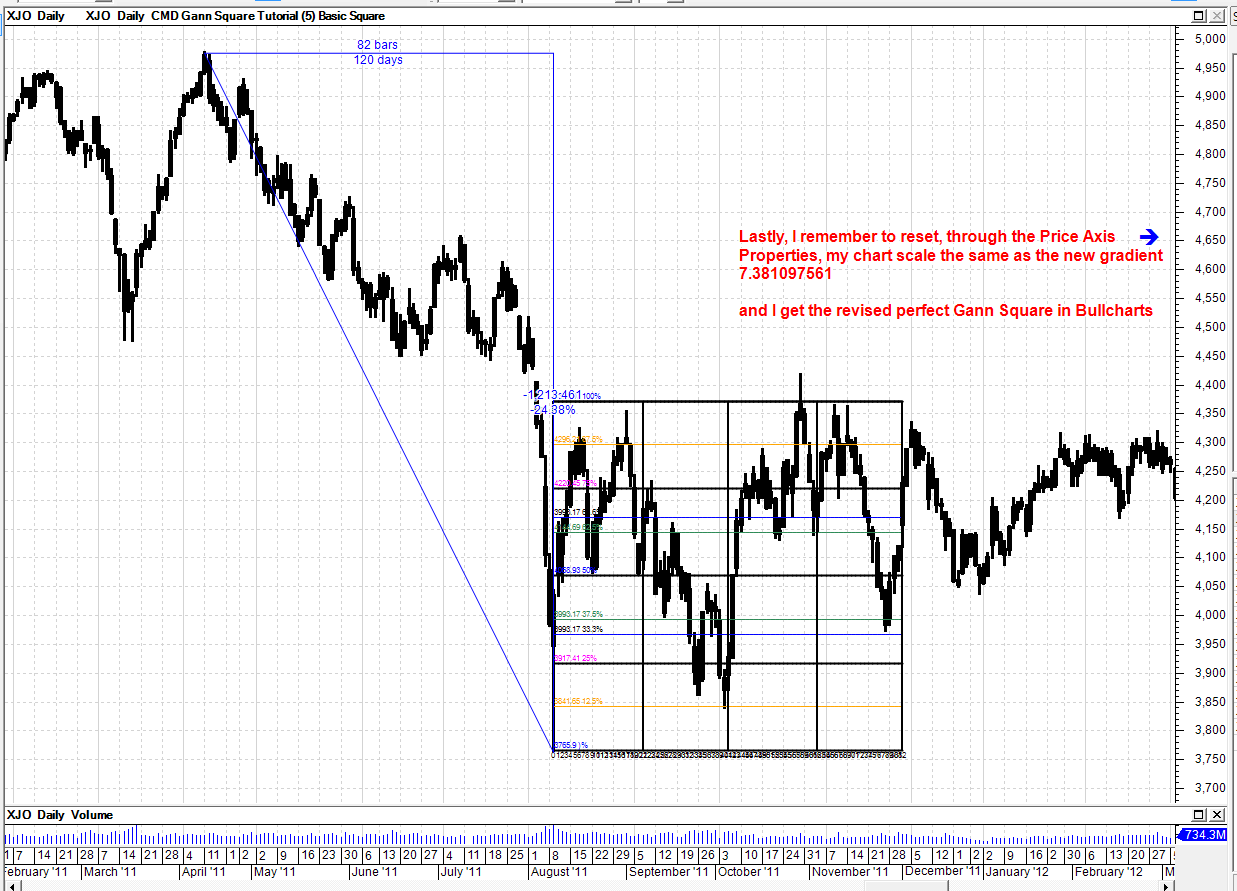
In this post, I assume you will now know how to scale the Bullcharts chart to produce a perfect Square on a chart, as previously discussed.
I will post 5 charts below with self explanatory notation and then the basic Bullscript code to draw the Gann Square outline from a significant low on a chart rather than use a Bullcharts tool. I think the Bullscript code gives you more control over the indicator being applied. Later on, in subsequent posts, I will provide a slightly different dating method so you can nominate any start data and set a low value to Square a chart from a Low, a high, a Zero or a based on a price range. But, this basic Bullscript indicator only needs you to insert or drag the indicator to a start point and enter a forecast trading day period and nominate a gradient to be used to draw the Square. It will automatically use the low from the selected starting date. I have left the input parameters in Bullscript to convert a daily Square into a compatible square for intraday use but will discuss that later when the complete Square indicator with Angles etc is provided. Note the starting gradient in the indicator code is set to 0.79 which might be applicable to some stocks like BHP that trade around the $30 to $40 level. An index like the ASX 200 used in the chart examples below may need a gradient around the 14 points per day level. Knowing the stock's unique vibration is the hard part in all this. I will discuss Gann's chart scaling and stock vibrations in greater deal later on as it is the most interesting issue to me in Gann's mathematical approach. At the moment we are just trying to understand how and why the Bullscript code shown further is written the way it is. How to pick an appropriate Stock Vibration will be covered in later posts but for now just use an inserted gradient to get used to applying a Square from a low and then setting the same scale in Bullcharts.  Edited by cmacdon - 11 Oct 2014 at 9:01am |
|
|
BC User since June 2007
|
|
 |
|
|
cmacdon
BullCharts Guru
Joined: 09 Sep 2012 Location: Brisbane Posts: 236 |
Post Options
Quote Reply
Posted: 11 Oct 2014 at 8:56am |
|
|
|
BC User since June 2007
|
|
|
|
|
cmacdon
BullCharts Guru
Joined: 09 Sep 2012 Location: Brisbane Posts: 236 |
Post Options
Quote Reply
Posted: 11 Oct 2014 at 8:56am |
|
|
|
BC User since June 2007
|
|
|
|
|
cmacdon
BullCharts Guru
Joined: 09 Sep 2012 Location: Brisbane Posts: 236 |
Post Options
Quote Reply
Posted: 11 Oct 2014 at 8:58am |
|
|
|
BC User since June 2007
|
|
|
|
|
cmacdon
BullCharts Guru
Joined: 09 Sep 2012 Location: Brisbane Posts: 236 |
Post Options
Quote Reply
Posted: 11 Oct 2014 at 9:00am |
|
|
|
BC User since June 2007
|
|
|
|
|
cmacdon
BullCharts Guru
Joined: 09 Sep 2012 Location: Brisbane Posts: 236 |
Post Options
Quote Reply
Posted: 11 Oct 2014 at 9:03am |
|
[author=Dr Charles MacDonald]
[citation="Bullcharts Forum, Gann subset and Bullscript discussions "] [Target=Price;] TDate:=InputDate("Date of trend", date(2014,3,24)); HD:=BarsSince(OnOrSkipped(TDate)); {------Note this is for intraday applications-------} tme:=input("1=daily,6=hourly,24=15mins 36=10, 72=5, 180=2 minutes", 1, 1, 180); z1:=If(HD,1,0); DwnswingCount:=If (z1,+prev(z1),0); DwnSwing:=barssince(z1=0); Bot:=valuewhen(1,HD=1,L); pdinp:=input("Average Day to calc gradient", 100, 1, 72000); {tme added for intraday conversion} pd:=pdinp; a:= input("Historical Gradient Vib => 1 X 1", 0.079, 0.00001, 10000); {---Conversion needed if applying daily angles on an intraday chart---} b:= a/tme; {--------This adds single text calc of the daily spread as a %-------} Gradient := b; {--------Some peripheral calculations need later on--------} {Count since start of Move} MoveSwing:=barssince(HD=0); {Adjacent} Days:=(DwnSwing-1); {----------------------Now Project the Top and Bottom for a Basic Square--------------------------} [name=O/8; linestyle=Horzline; Width=2; color=Black; visible=yes] bottom:=If ({HD and }Dwnswing <=pd+1,Bot,undefined); bottom; [linestyle=Text; fontsize=6; textalign=Below,center;color=Black;] if(barssince(Z1=0)and Dwnswing <=pd+1, int(Dwnswing-1) + " ", undefined); bottom; [name=8/8; linestyle=Horzline; Width=2; color=Black; visible=yes] Top:=If (HD and Dwnswing <=pd+1,(Bot-b) +(pd+1)*b,undefined); Top; {------add Gann Percentage levels within the square----------------------} [name=1/8; linestyle=Horzline; Width=1; color=Orange; visible=yes] oneeight:=If(HD and Dwnswing <=pd+1,Bottom + (Top-Bottom)*1/8,undefined); oneeight; [name=2/8;color=Black;Width=2;]; twoeight:=If(HD and Dwnswing <=pd+1, Bottom + (Top-Bottom)*2/8,undefined); twoeight; [name=3/8; Width=1; color=Sea Green]; threeeight:=If(HD and Dwnswing <=pd+1, Bottom + (Top-Bottom)*3/8,undefined); threeeight; [name=4/8;color=Black;Width=2;]; foureight:=If(HD and Dwnswing <=pd+1, Bottom + (Top-Bottom)*4/8,undefined); foureight; [name=5/8; Width=1; color=Sea Green]; fiveeight:=If(HD and Dwnswing <=pd+1, Bottom + (Top-Bottom)*5/8,undefined); fiveeight; [name=6/8; color=Black;Width=2;]; sixeight:=If(HD and Dwnswing <=pd+1, Bottom + (Top-Bottom)*6/8,undefined); sixeight; [name=7/8; Width=1; color=Orange;] seveneight:=If(HD and Dwnswing <=pd+1, Bottom + (Top-Bottom)*7/8,undefined); seveneight; [name=8/8; color=Black;Width=2;]; eighteight:=If(HD and Dwnswing <=pd+1,Top,undefined); eighteight; [name=8/8; Width=1; color=Blue;] onethird:=If(HD and Dwnswing <=pd+1, Bottom + (Top-Bottom)*1/3,undefined); onethird; Twothird:=If(HD and Dwnswing <=pd+1, Bottom + (Top-Bottom)*2/3,undefined); Twothird; {Draw verticle Line as time elapses within the Square} [name=Start line; Linestyle=Fill Bars; Width=2; color=Black;] if(HD and Dwnswing=1,Top,undefined); if(HD and Dwnswing=1,Bot,undefined); [name=Quarter Time;] If (Dwnswing= round(((pd)/4)+1,0),Top,undefined); If (Dwnswing= round(((pd)/4)+1,0),Bot,undefined); [name=Half Time;] If (Dwnswing= round(((pd)/2)+1,0),Top,undefined); If (Dwnswing= round(((pd)/2)+1,0),Bot,undefined); [name=Three Quarter Time;] If (Dwnswing= round(((pd)*3/4),0)+1,Top,undefined); If (Dwnswing= round(((pd)*3/4),0)+1,Bot,undefined); [name=Price and time sb Square;] If (Dwnswing= round(((pd)),0)+1,Top,undefined); If (Dwnswing= round(((pd)),0)+1,Bot,undefined); Tp1:=If (Dwnswing= round(((pd)/4)+1,0),1,undefined); Tp2:=If (Dwnswing= round(((pd)/2)+1,0),1,undefined); Tp3:=If (Dwnswing= round(((pd)*3/4),0)+1,1,undefined); Tp4:=If (Dwnswing= round(((pd)),0)+1,1,undefined); {---Add Gann text applied to 1/8 and 1/3 Percentages Grid levels---Note Murrey Math also uses the 1/8 levels----} [linestyle=Text; textalign=Above,Left; color=Blue;] if(HD and Dwnswing <=1 and Bottom, Round(Bottom,2) + " )% ", undefined);Bottom; [linestyle=Text; textalign=Above,Left; color=Orange;] if(HD and Dwnswing <=1 and oneeight, Round(oneeight,2) + " 12.5% ", undefined);oneeight; [linestyle=Text; textalign=Above,Left; color=Magenta; ] if(HD and Dwnswing <=1 and twoeight, Round(twoeight,2) + " 25% ", undefined);twoeight; [linestyle=Text; textalign=Above,Left; color=Black; ] if(HD and Dwnswing <=1 and threeeight, Round(threeeight,2) + " 33.3% ",undefined);onethird; [linestyle=Text; textalign=Above,Left; color=Sea Green; ] if(HD and Dwnswing <=1 and threeeight, Round(threeeight,2) + " 37.5% ",undefined);threeeight; [linestyle=Text; textalign=Above,Left; color=Blue; ] if(HD and Dwnswing <=1 and foureight, Round(foureight,2) + " 50% ",undefined); foureight; [linestyle=Text; textalign=Above,Left; color=Sea Green; ] if(HD and Dwnswing <=1 and fiveeight, Round(fiveeight,2) + " 62.5% ", undefined);fiveeight; [linestyle=Text; textalign=Above,Left; color=Black; ] if(HD and Dwnswing <=1 and threeeight, Round(threeeight,2) + " 66.6% ",undefined);twothird; [linestyle=Text; textalign=Above,Left; color=Magenta; ] if(HD and Dwnswing <=1 and sixeight, Round(sixeight,2) + " 75% ", undefined);sixeight; [linestyle=Text; textalign=Above,Left; color=Orange; ] if(HD and Dwnswing <=1 and seveneight, Round(seveneight,2) + " 87.5% ",undefined);seveneight; [linestyle=Text; textalign=Above,Left; color=Blue; ] if(HD and Dwnswing <=1 and eighteight, Round(eighteight,2) + " 100% ",undefined);eighteight; |
|
|
BC User since June 2007
|
|
|
|
|
cmacdon
BullCharts Guru
Joined: 09 Sep 2012 Location: Brisbane Posts: 236 |
Post Options
Quote Reply
Posted: 11 Oct 2014 at 9:27am |
|
Just some further Bullscript discussion.
There may be other ways to draw a Square similar to some coding used for drawing Darvas boxes but I have never been able to adapt them for Gann Squaring Applications. The hardest part above was to work out how to code the vertical lines within and on the sides of the Gann Square. To do that you essentially need to have a piece of script that, in my case, draws a bottom line and is counting the bars as they evolve from a forecast starting point in time. At appropriate times, say each quarter period in time along the forecast time period it will draw a vertical line at that point. Using the vertical market linestyle was not appropriate as it goes well beyond the boundary of a square. The counting bar line in the above scrip is also important for mathematically working out and drawing Gann Angles from a starting point and also from the top or the bottom of quarter time periods within a Square, and if the indicator is extended to two side by side Gann Squares. One draw back in Bullcharts at present is that if you start a Gann square too close to the right hand edge the indicator will evolve as price action progresses. It will not extend beyond current price action into the blank space to the right of the price action. In other words, the Bullscript indicator will not draw a forecast 100 days into the future if say only 10 days have elapsed since the start date. It will pick up the evolving frame work for the first 10 days. However, what it does which is really great is that the indicator with set parameters will stay on the chart and fully form over the next 90 days and you will not have any problem with having to constantly rescale a chart which with some software can lead to things like Gann angles moving and not staying exactly at the same degree angles as were originally drawn because some software will constantly autoscale the chart. Using horizontal shift in the advanced tab section of an indicator is a possible way to get around this issue as you could horizontally shift the Gann Square 100 days to the tight in white space. But in practice what I prefer to do is set up the Gann daily Square parameters and then I trade on intraday time frames and can set the Gann Square to replicate in the correct proportions on an intraday chart and that will be discussed further on. So extending a Gann Square into white space is an aesthetic thing not a hindrance to trading using the Gann Square indicator. Edited by cmacdon - 11 Oct 2014 at 9:31am |
|
|
BC User since June 2007
|
|
|
|
|
Post Reply
|
| Forum Jump | Forum Permissions You cannot post new topics in this forum You cannot reply to topics in this forum You cannot delete your posts in this forum You cannot edit your posts in this forum You cannot create polls in this forum You cannot vote in polls in this forum |


