Intraday trading Support and resistance and trend |
Post Reply 
|
Page 123> |
| Author |
 Printable Version Printable Version Delicious Delicious Digg Digg Facebook Facebook Furl Furl Google Boomarks Google Boomarks Google Buzz Google Buzz MySpace MySpace Newsvine Newsvine reddit reddit StumbleUpon Translate StumbleUpon Translate Twitter Twitter Windows Live Windows Live Yahoo Bookmarks Yahoo Bookmarks Topic Search Topic Search  Topic Options Topic Options
|
cmacdon 
BullCharts Guru 
Joined: 09 Sep 2012 Location: Brisbane Posts: 236 |
 Post Options Post Options
 Quote Reply Quote Reply
 Topic: Intraday trading Support and resistance and trend Topic: Intraday trading Support and resistance and trendPosted: 28 Dec 2012 at 2:48pm |
|
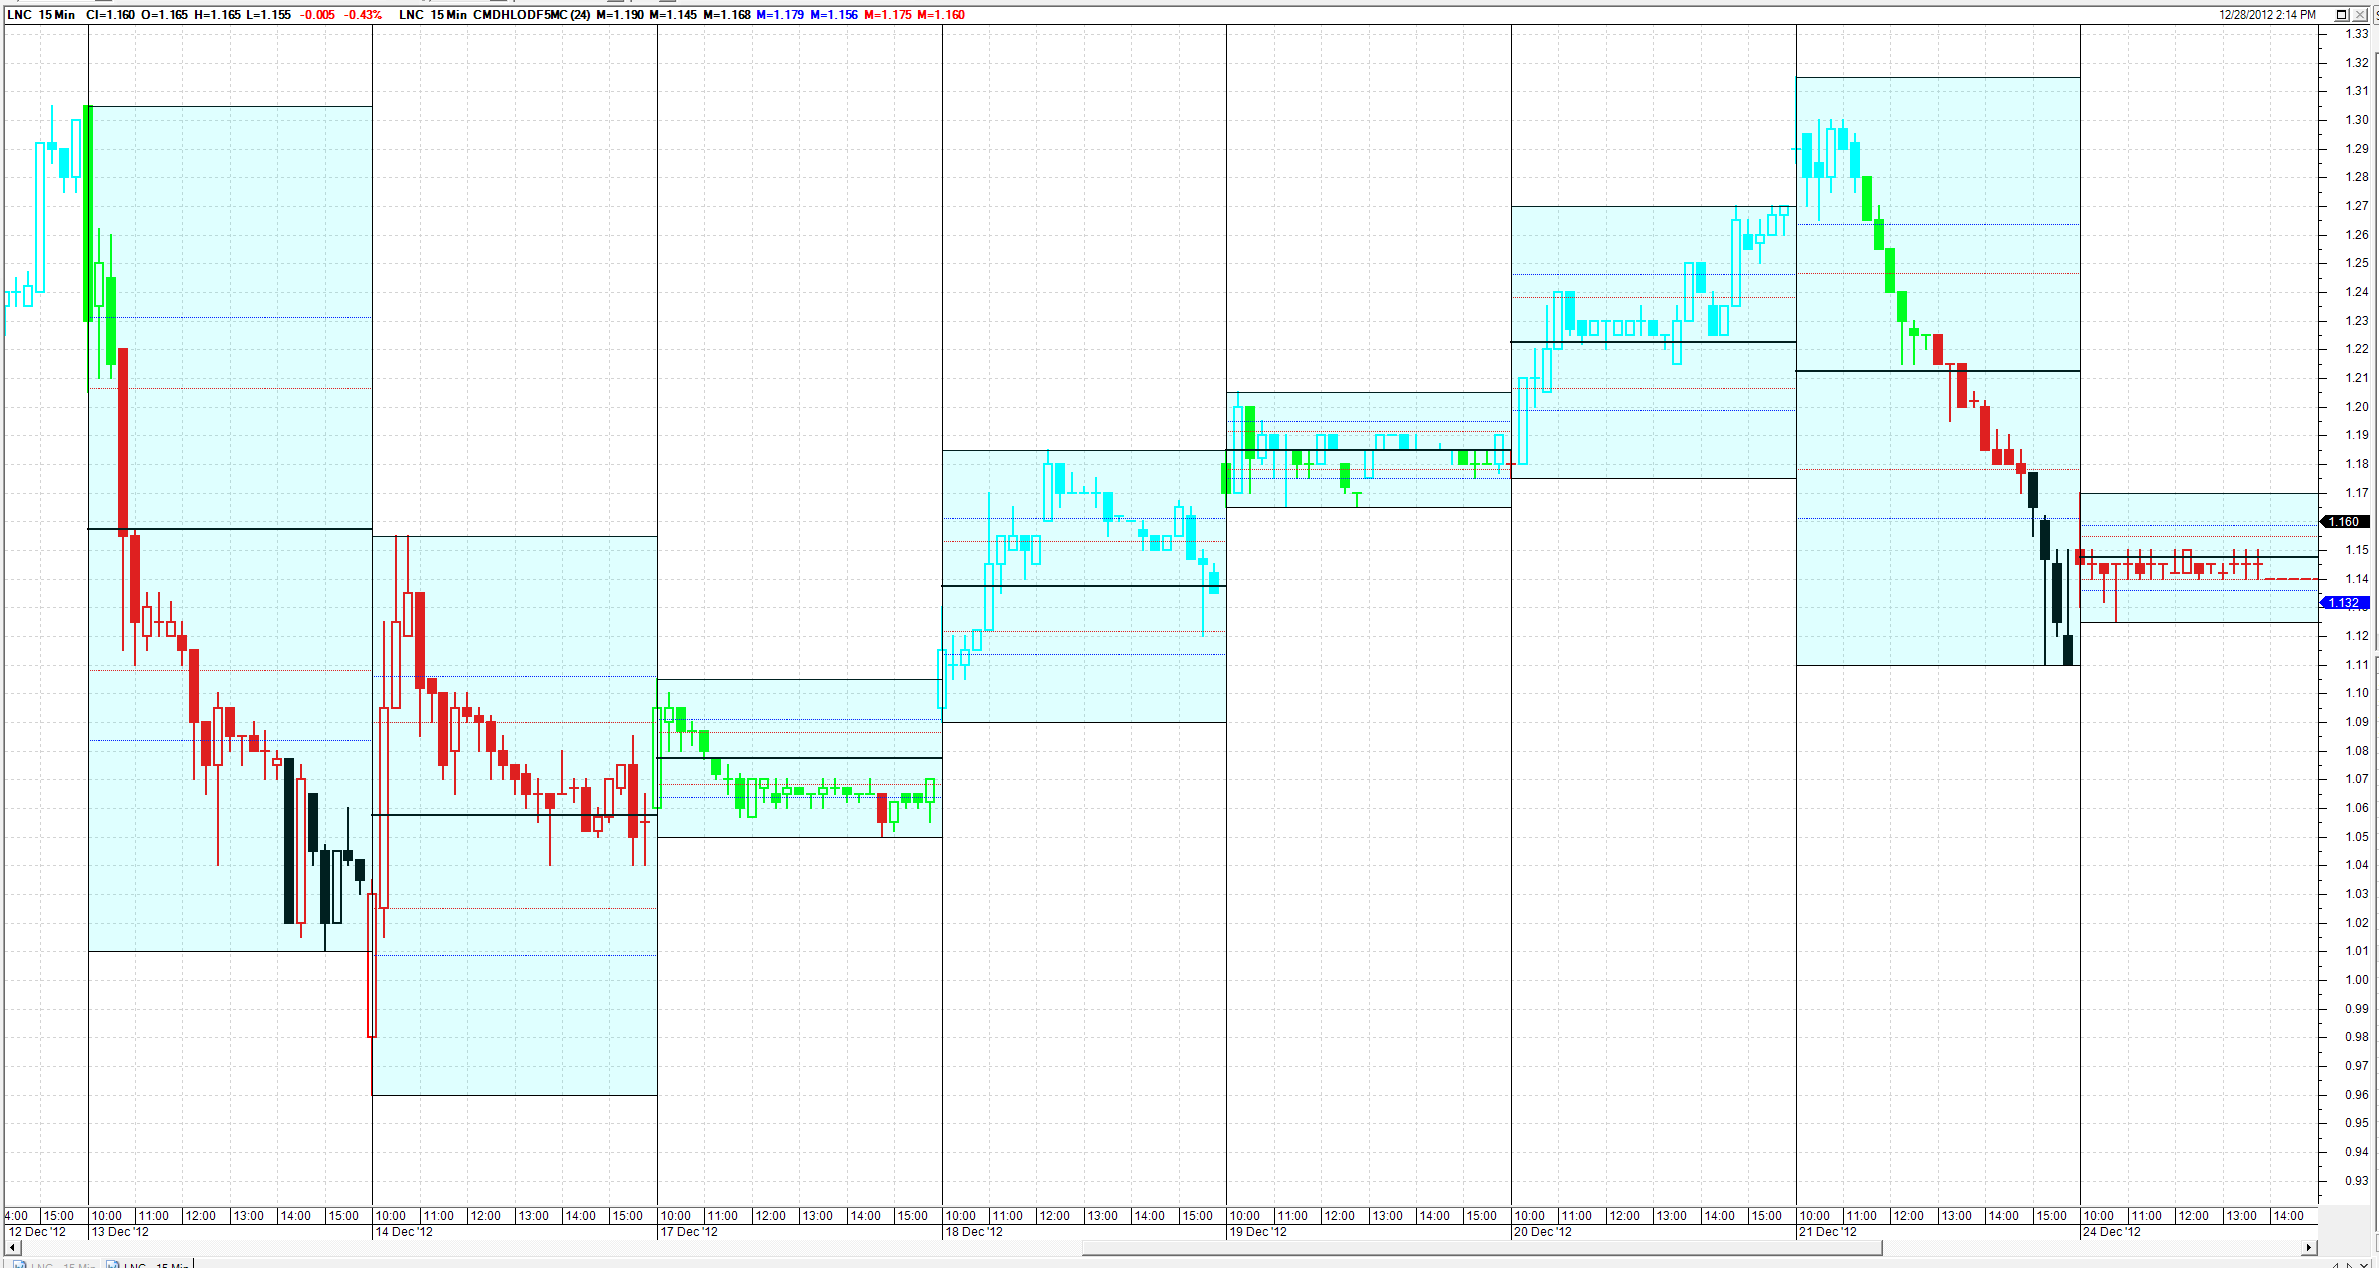
Various writers Linda Bradford Rashke, Al Brooks , Mark B. Fisher when discussing
intraday trading suggests that the High or Low of the previous Day are
important support and resistance levels for the next days trading decisions. Here are a couple of indicators that show the previous day’s
High and Low levels. The Highs or lows are drawn horizontally 1 bar at a time
whilst each of the following day’s similar
time periods elapses. Depending on the intraday time frame adopted ,the setting of
the indicator should be changed e.g. there are 24 X 15 minute periods in 6
hours of ASX trading so if you use a 15 minute chart the setting is 24. A 5 minute chart has a setting of 72 etc. The settings identify the bars in the
previous day for the indicator to do its thing measuring the highest high or low over that indicator period. You can also go into Advance tab and do a Horizontal shift
of -24 or -72 and the high and low will
be shifted to the day before. Once set
up I save as templates for 5 min, 15 min and hourly charts. I put on some Gann levels for: 25%, 50% 75%, 33% and 66% between the Highs and lows for
interest so you can see if current price is starting to get relatively stronger
of weaker. The bars have been color coded for position of the close of a
new bar relative to yesterday’s support and resistance or for breaking outside
yesterday’s high or low. (Cyan if close
is above yesterdays high, Lime if close is above the 50% level of yesterday and
below yesterday’s high. Red if below the
50% level and above yesterday’s low and black if the bar is below yesterday’s
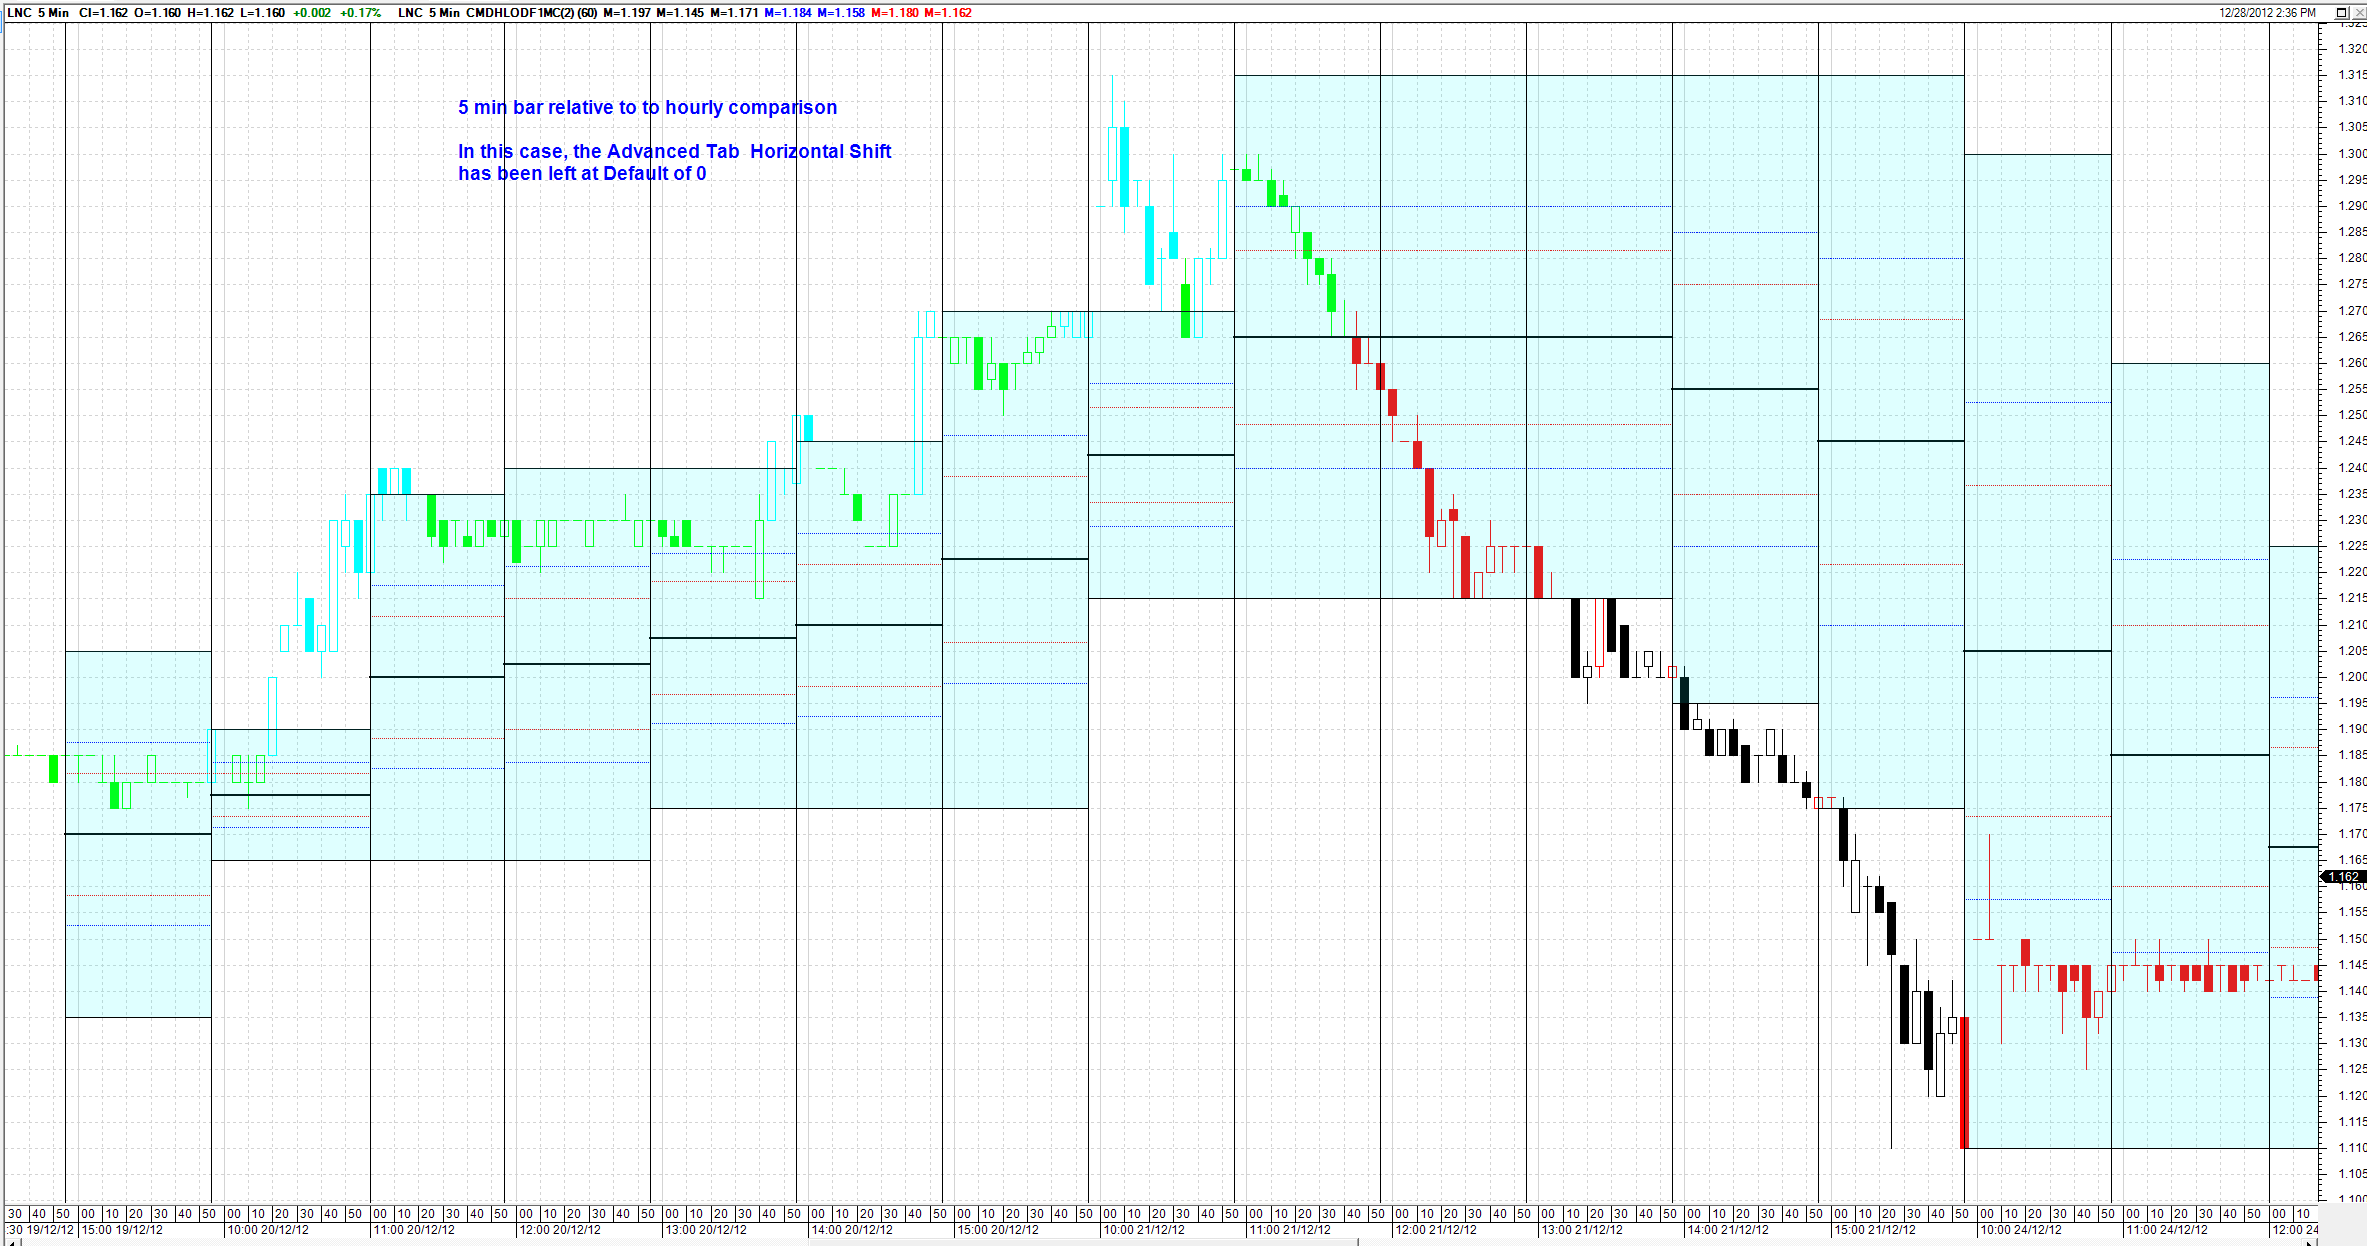
low). The second indicator is similar but the comparative High and
Low resistance is for the previous hour rather than yesterday. (The indicator is not so good if there are public holiday
intraday time periods so charts below show more normalized trading periods). Also below is a code for similar logic but a new bar is coloured relative the high or low of the previous hour's high or low.
|
|
|
BC User since June 2007
|
|
 |
|
|
cmacdon
BullCharts Guru
Joined: 09 Sep 2012 Location: Brisbane Posts: 236 |
Post Options
Quote Reply
Posted: 28 Dec 2012 at 2:49pm |

|
|
|
BC User since June 2007
|
|
|
|
|
cmacdon
BullCharts Guru
Joined: 09 Sep 2012 Location: Brisbane Posts: 236 |
Post Options
Quote Reply
Posted: 28 Dec 2012 at 2:50pm |
|
|
|
BC User since June 2007
|
|
|
|
|
cmacdon
BullCharts Guru
Joined: 09 Sep 2012 Location: Brisbane Posts: 236 |
Post Options
Quote Reply
Posted: 28 Dec 2012 at 2:54pm |
|
Code for 15 minute bars compared to day before High or Low.
I forgot to mention I also [target =price; author= C MacDonald; ]
{ e.g 24 for 15minute charts and 60 for 5 min charts} n := input("Divide 6 hours by intraday time period",24); { This is intended to only show indicators at begining of the day so can position for day trading without clutter} {Identifies first bar of the day See Definition under Hour in Help} prelimOpBar:= if(Hour<hist(Hour,1),1,undefined); OpBar:= if(Hist(prelimOpBar,1) OR Hist(prelimOpBar,2) OR Hist(prelimOpBar,3) OR Hist(prelimOpBar,4) OR Hist(prelimOpBar,5) OR Hist(prelimOpBar,6) OR Hist(prelimOpBar,7) OR Hist(prelimOpBar,8) OR Hist(prelimOpBar,9) OR Hist(prelimOpBar,10) OR Hist(prelimOpBar,11) OR Hist(prelimOpBar,12) OR Hist(prelimOpBar,13) OR Hist(prelimOpBar,14) OR Hist(prelimOpBar,15) OR Hist(prelimOpBar,16) OR Hist(prelimOpBar,17) OR Hist(prelimOpBar,18) OR Hist(prelimOpBar,19) OR Hist(prelimOpBar,20) OR Hist(prelimOpBar,21) OR Hist(prelimOpBar,22) OR Hist(prelimOpBar,23) OR Hist(prelimOpBar,24), 1,undefined); {Identifies first bar of the day See Definition under Hour in Help} [name =Maxed Out Ultra High Vol; Width=1; linestyle=verticalmarker; Color=Black] { Ultra High Volume} if (Hour<hist(Hour,1),c,undefined); [linestyle =horz step] a:= if(prelimOpBar,highest(Hist(High,1),n),undefined); a; b:= if(prelimOpBar,Lowest(Hist(Low,1),n),undefined); b;
[linestyle =horz step; color=Black; Width=2;] G50:=b+0.5*(a-b); G50; [linestyle =dotted step; color=Blue; Width=1;] G75:=b+0.75*(a-b); G75; G25:=b+0.25*(a-b); G25; [linestyle =dotted step; color=red;] G66:=b+0.666666*(a-b); G66; G33:=b+0.333333*(a-b); G33;
[name =Fill; linestyle=fill step; color =Cyan;] a; b; [linestyle =pricecolor] [color =Cyan] If (Opbar=1 AND Close>=valuewhen(1,prelimOpBar,a),1,undefined);
[color =Lime] If (Opbar=1 AND Close>=valuewhen(1,prelimOpBar,g50),1,undefined);
[color =Black] If (Opbar=1 AND Close<valuewhen(1,prelimOpBar,b),1,undefined);
[color =Red] If (Opbar=1 AND Close<valuewhen(1,prelimOpBar,g50),1,undefined);
[color =Blue] true; {This adds single tezxt calc of the daily spread as a %} Spreadtxt := Valuewhen(prelimOpBar,((a/b)-1)*100); {This part displays the latest daily spread as a percentage} sptx:= IF(systemdate=Systemdate ,SpreadTxt, Undefined); [linestyle =Text; textalign=Above,Left; target=price; visible=yes] if (barnumber=lastvalue(barnumber), Round(sptx,2) + "% Spread DB4" , undefined);Low*0.98; put in a clculation on curent day of teh % price spread of the day before |
|
|
BC User since June 2007
|
|
|
|
|
cmacdon
BullCharts Guru
Joined: 09 Sep 2012 Location: Brisbane Posts: 236 |
Post Options
Quote Reply
Posted: 28 Dec 2012 at 2:59pm |
|
On the code posted above change the indicator setting to 72 not 60 (i.e 12 X 5mins per hour X 6 Hours per trading day Below is code for 5 minute bars compared to previous hour high or Low[target =price; author= C MacDonald; ]
{ e.g 24 for 15minute charts and 72 for 5 min charts} n := input("Divide 6 hours by intraday time period",72); { This is intended to only show indicators at begining of the day so can position for day trading without clutter} {Identifies first bar of the day See Definition under Hour in Help} prelimOpBar:= if(Minute<hist(Minute,1),1,undefined); OpBar:= if(Hist(prelimOpBar,1) OR Hist(prelimOpBar,2) OR Hist(prelimOpBar,3) OR Hist(prelimOpBar,4) OR Hist(prelimOpBar,5) OR Hist(prelimOpBar,6) OR Hist(prelimOpBar,7) OR Hist(prelimOpBar,8) OR Hist(prelimOpBar,9) OR Hist(prelimOpBar,10) OR Hist(prelimOpBar,11) OR Hist(prelimOpBar,12) OR Hist(prelimOpBar,13) OR Hist(prelimOpBar,14) OR Hist(prelimOpBar,15) OR Hist(prelimOpBar,16) OR Hist(prelimOpBar,17) OR Hist(prelimOpBar,18) OR Hist(prelimOpBar,19) OR Hist(prelimOpBar,20) OR Hist(prelimOpBar,21) OR Hist(prelimOpBar,22) OR Hist(prelimOpBar,23) OR Hist(prelimOpBar,24) OR Hist(prelimOpBar,25) OR Hist(prelimOpBar,26) OR Hist(prelimOpBar,27) OR Hist(prelimOpBar,28) OR Hist(prelimOpBar,29) OR Hist(prelimOpBar,30) OR Hist(prelimOpBar,31) OR Hist(prelimOpBar,32) OR Hist(prelimOpBar,33) OR Hist(prelimOpBar,34) OR Hist(prelimOpBar,35) OR Hist(prelimOpBar,36) OR Hist(prelimOpBar,37) OR Hist(prelimOpBar,38) OR Hist(prelimOpBar,39) OR Hist(prelimOpBar,40) OR Hist(prelimOpBar,41) OR Hist(prelimOpBar,42) OR Hist(prelimOpBar,43) OR Hist(prelimOpBar,44) OR Hist(prelimOpBar,45) OR Hist(prelimOpBar,46) OR Hist(prelimOpBar,47) OR Hist(prelimOpBar,48) OR Hist(prelimOpBar,49) OR Hist(prelimOpBar,50) OR Hist(prelimOpBar,51) OR Hist(prelimOpBar,52) OR Hist(prelimOpBar,53) OR Hist(prelimOpBar,54) OR Hist(prelimOpBar,55) OR Hist(prelimOpBar,56) OR Hist(prelimOpBar,57) OR Hist(prelimOpBar,58) OR Hist(prelimOpBar,59) OR Hist(prelimOpBar,60) OR Hist(prelimOpBar,61) OR Hist(prelimOpBar,62) OR Hist(prelimOpBar,63) OR Hist(prelimOpBar,64) OR Hist(prelimOpBar,65) OR Hist(prelimOpBar,66) OR Hist(prelimOpBar,67) OR Hist(prelimOpBar,68) OR Hist(prelimOpBar,69) OR Hist(prelimOpBar,70) OR Hist(prelimOpBar,71) OR Hist(prelimOpBar,72), 1,undefined);
{Identifies first bar of the day See Definition under Hour in Help} [name =Maxed Out Ultra High Vol; Width=1; linestyle=verticalmarker; Color=Black] { Ultra High Volume} if (Minute<hist(Minute,1),c,undefined);
[linestyle =horz step] a:= if(prelimOpBar,highest(Hist(High,1),n),undefined); a; b:= if(prelimOpBar,Lowest(Hist(Low,1),n),undefined); b;
[linestyle =horz step; color=Black; Width=2;] G50:=b+0.5*(a-b); G50; [linestyle =dotted step; color=Blue; Width=1;] G75:=b+0.75*(a-b); G75; G25:=b+0.25*(a-b); G25; [linestyle =dotted step; color=red;] G66:=b+0.666666*(a-b); G66; G33:=b+0.333333*(a-b); G33;
[name =Fill; linestyle=fill step; color =Cyan;] a; b;
[linestyle =pricecolor]
[color =Cyan] If (Opbar=1 AND Close>=valuewhen(1,prelimOpBar,a),1,undefined);
[color =Lime] If (Opbar=1 AND Close>=valuewhen(1,prelimOpBar,g50),1,undefined);
[color =Black] If (Opbar=1 AND Close<valuewhen(1,prelimOpBar,b),1,undefined);
[color =Red] If (Opbar=1 AND Close<valuewhen(1,prelimOpBar,g50),1,undefined);
[color =Blue] true; |
|
|
BC User since June 2007
|
|
|
|
|
cmacdon
BullCharts Guru
Joined: 09 Sep 2012 Location: Brisbane Posts: 236 |
Post Options
Quote Reply
Posted: 28 Dec 2012 at 3:17pm |
|
Sorry forget my short note immediatly above, I am confusing myself with different time periods The First code is correct with 24 setting for a 15 minute bar chart and 24 bars identified in the Opbar definition
Second code is correct for a setting of 72 for 5 minute charts and 72 bars coded in the Opbar definition. Charles
|
|
|
BC User since June 2007
|
|
|
|
|
paulchow2k
Newbie 
Joined: 15 Oct 2010 Posts: 7 |
Post Options
Quote Reply
Posted: 05 Jun 2013 at 11:50pm |
|
Hi Charles,
Regarding intraday over the weekend or holidays, I find that using course of trades to find where price creates support and resistance levels. So on each bar, I could tell where support and resistance is. I just don't know if there is a bullcharts script for that. Regards Paul |
|
|
|
|
cmacdon
BullCharts Guru
Joined: 09 Sep 2012 Location: Brisbane Posts: 236 |
Post Options
Quote Reply
Posted: 06 Jun 2013 at 7:09am |
|
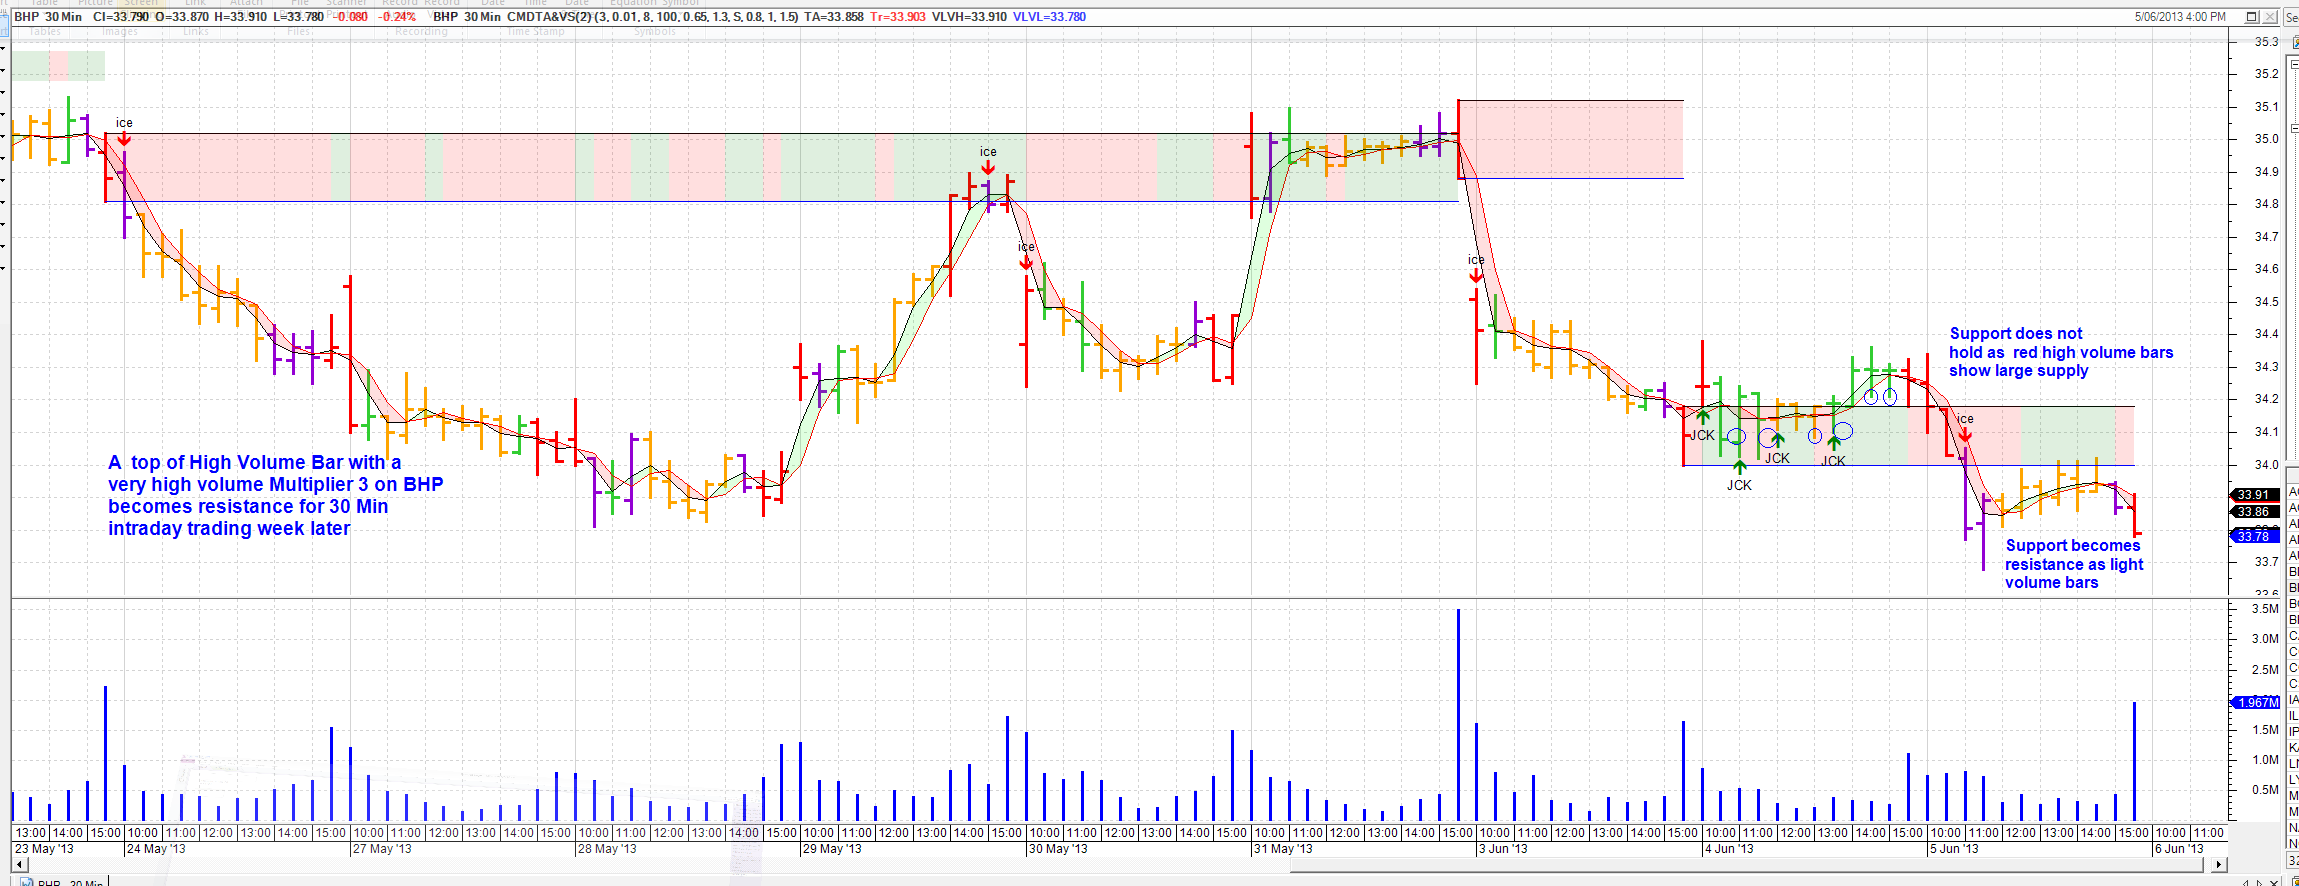
Paul
I do not use Course of Trades Report from Bull charts but it seems to be just Price level x Volume = Value of trades. If you look at the Natural Support and Resistance Based on Volume posts in this Forum I think you can find a Volume Multiplier you can use on intraday charts that will save you a lot of time analyzing a course of trades report. I will post two examples below for a 10 Minute and 30 Minute charts showing that playing around with the Volume Multiplier finds the main Support levels. 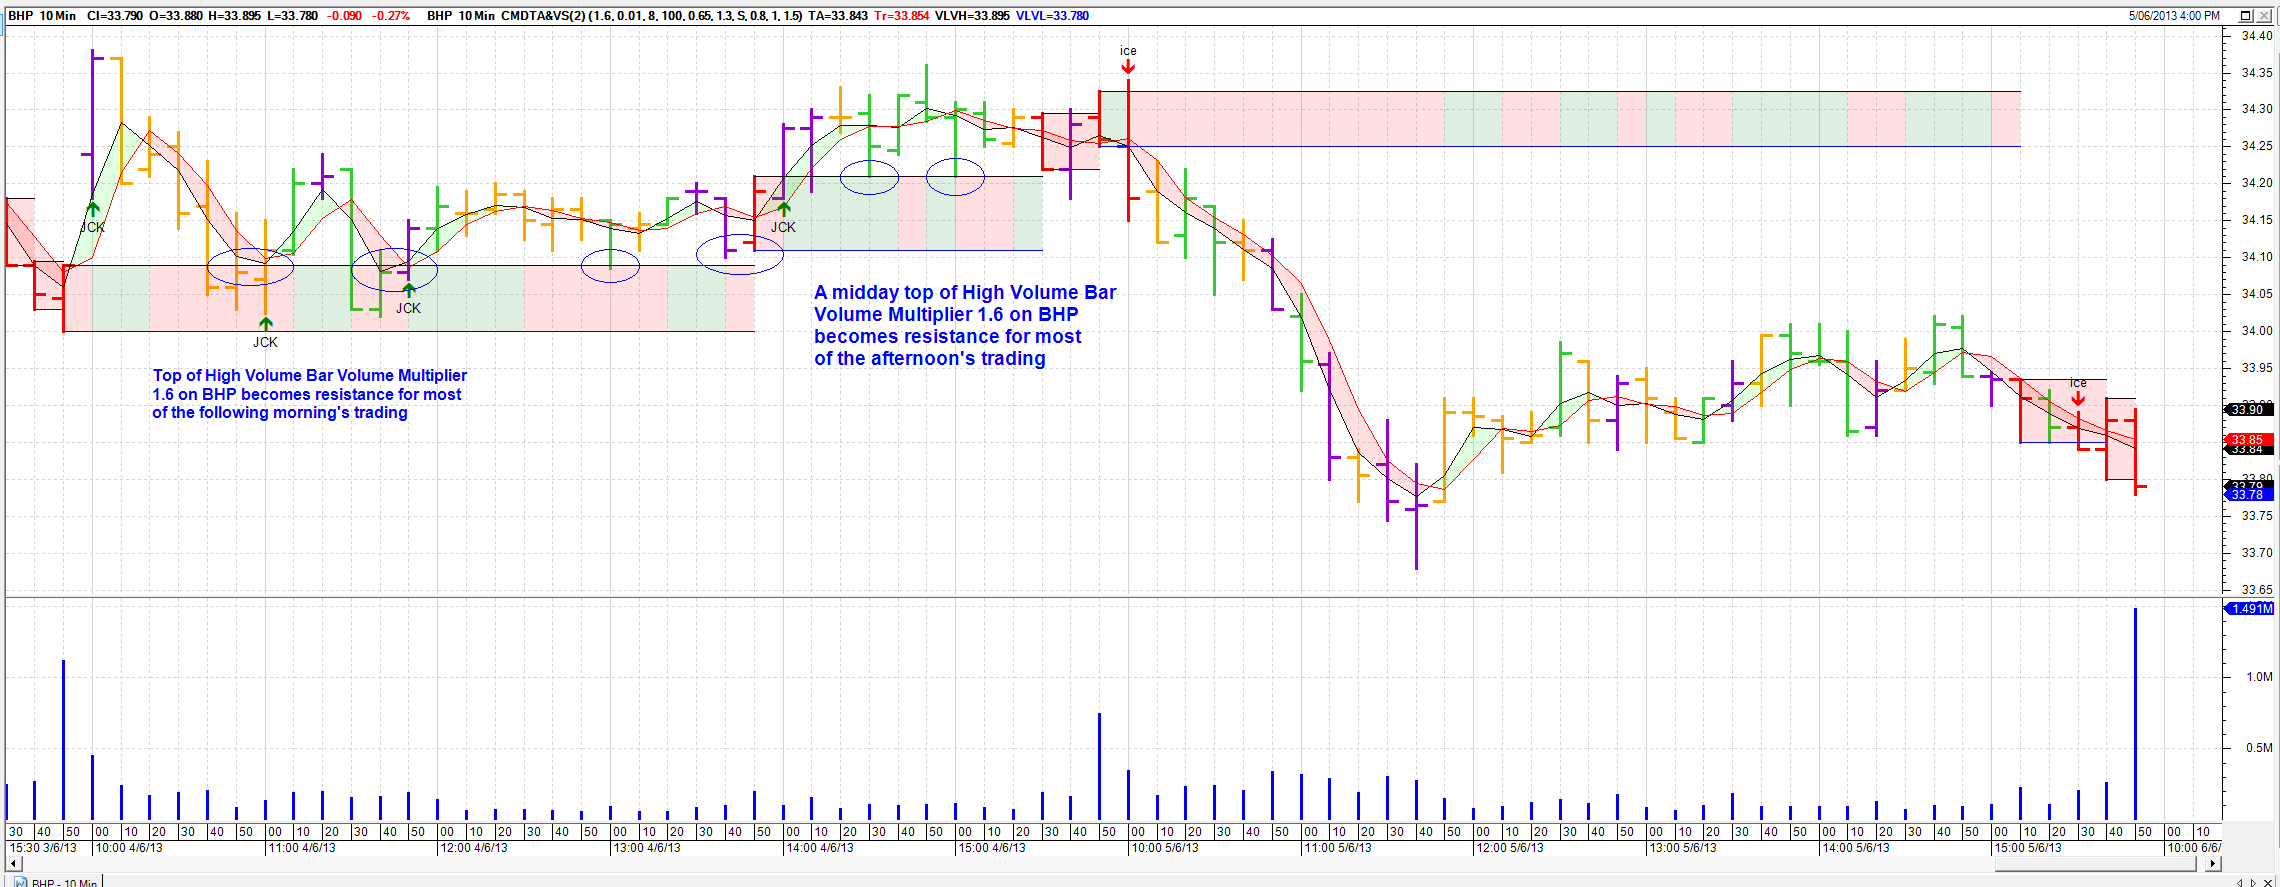
|
|
|
BC User since June 2007
|
|
|
|
|
cmacdon
BullCharts Guru
Joined: 09 Sep 2012 Location: Brisbane Posts: 236 |
Post Options
Quote Reply
Posted: 06 Jun 2013 at 7:10am |
|
|
|
BC User since June 2007
|
|
|
|
|
cmacdon
BullCharts Guru
Joined: 09 Sep 2012 Location: Brisbane Posts: 236 |
Post Options
Quote Reply
Posted: 06 Jun 2013 at 7:13am |
|
The only variation I have done to the previous volume Multiplier indicators is that these ones now colour fill the multiplier range according to whether the price is in a relative up or down trend relative to that support or resistance range. |
|
|
BC User since June 2007
|
|
|
|
|
Post Reply
|
Page 123> |
| Forum Jump | Forum Permissions You cannot post new topics in this forum You cannot reply to topics in this forum You cannot delete your posts in this forum You cannot edit your posts in this forum You cannot create polls in this forum You cannot vote in polls in this forum |