Smart Money |
Post Reply 
|
Page 12> |
| Author |
 Printable Version Printable Version Delicious Delicious Digg Digg Facebook Facebook Furl Furl Google Boomarks Google Boomarks Google Buzz Google Buzz MySpace MySpace Newsvine Newsvine reddit reddit StumbleUpon Translate StumbleUpon Translate Twitter Twitter Windows Live Windows Live Yahoo Bookmarks Yahoo Bookmarks Topic Search Topic Search  Topic Options Topic Options
|
cmacdon 
BullCharts Guru 
Joined: 09 Sep 2012 Location: Brisbane Posts: 236 |
 Post Options Post Options
 Quote Reply Quote Reply
 Topic: Smart Money Topic: Smart MoneyPosted: 29 Sep 2012 at 6:37pm |
|
Tom
Williams writing about Volume Spread Analysis
(VSA) groups traders into Smart Money and the Herd. He advises that Smart Money have to sell
into uptrends and buy in to down trends which is the opposite of the way
traders normally think. This contrarian
concept has puzzled me for a long time.
Re-reading Larry William’s (no relation to Tom) book Long Term
Secrets to Short Term Trading, offers a possible solution. Larry Williams states that since 1965 his
operating rule has been “sellers in any time period are represented by the
price swing from the high of the day to the close, while buying is represented
by the close minus the low”, p.36, John Wiley & Co, 1999. I think Chaikin’s Money flow uses similar
concepts. So
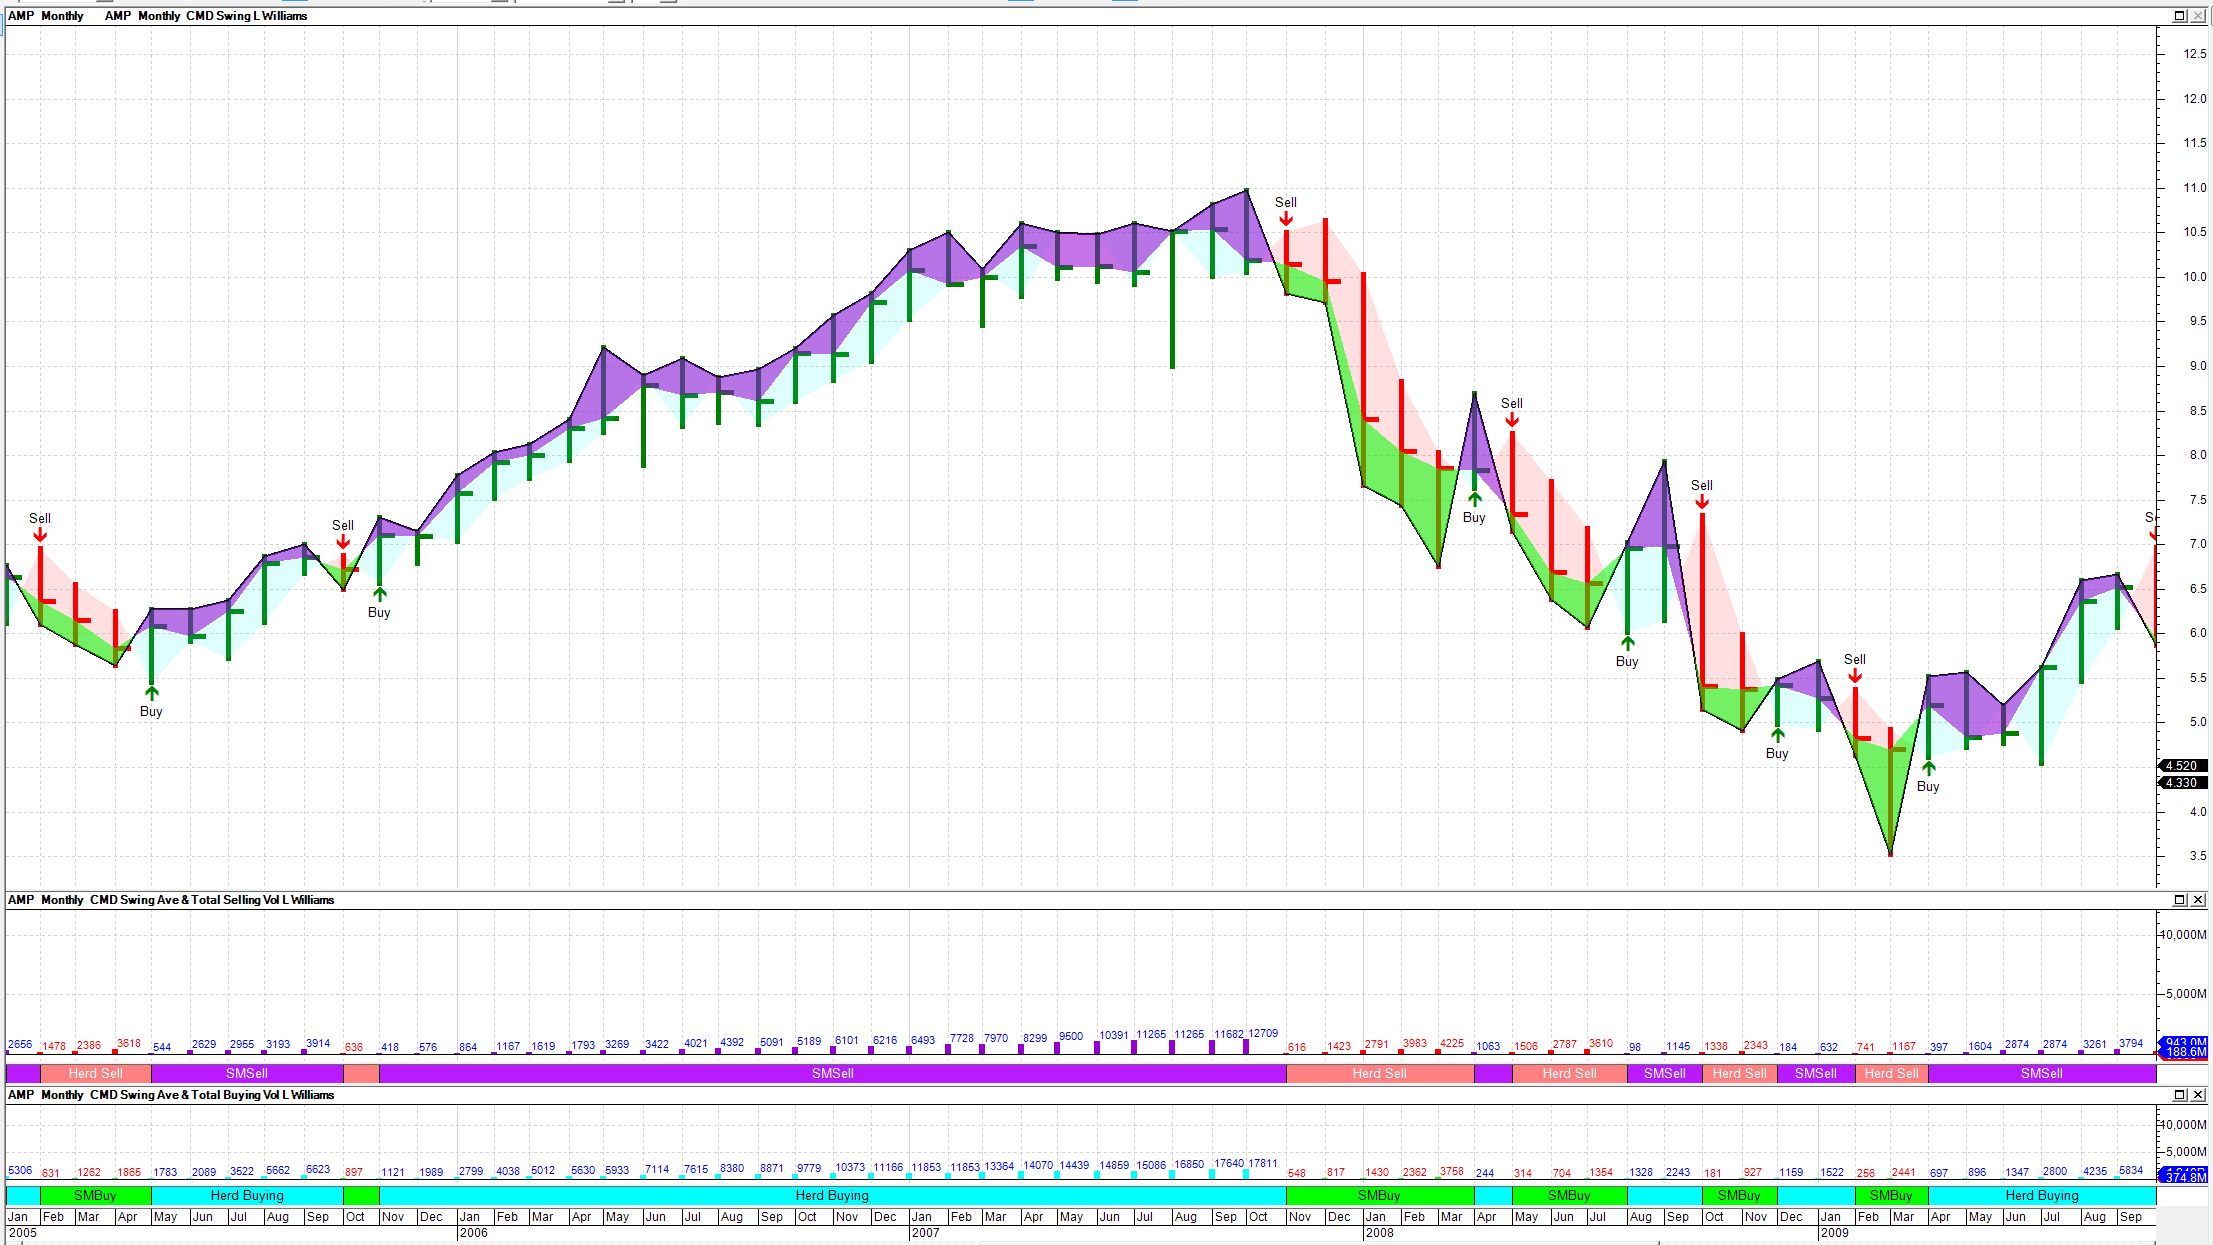
here is how my new Bull chart template looks. I adapted as discussed further
below the Wave Volume indicator provided in other post re Weiss Wave. Two indicators are required. This is not any
sort of investment advice but education on writing the indicators. The charts show Buy and Sell becasuse the markers are set up to identify start and end of trend only. The
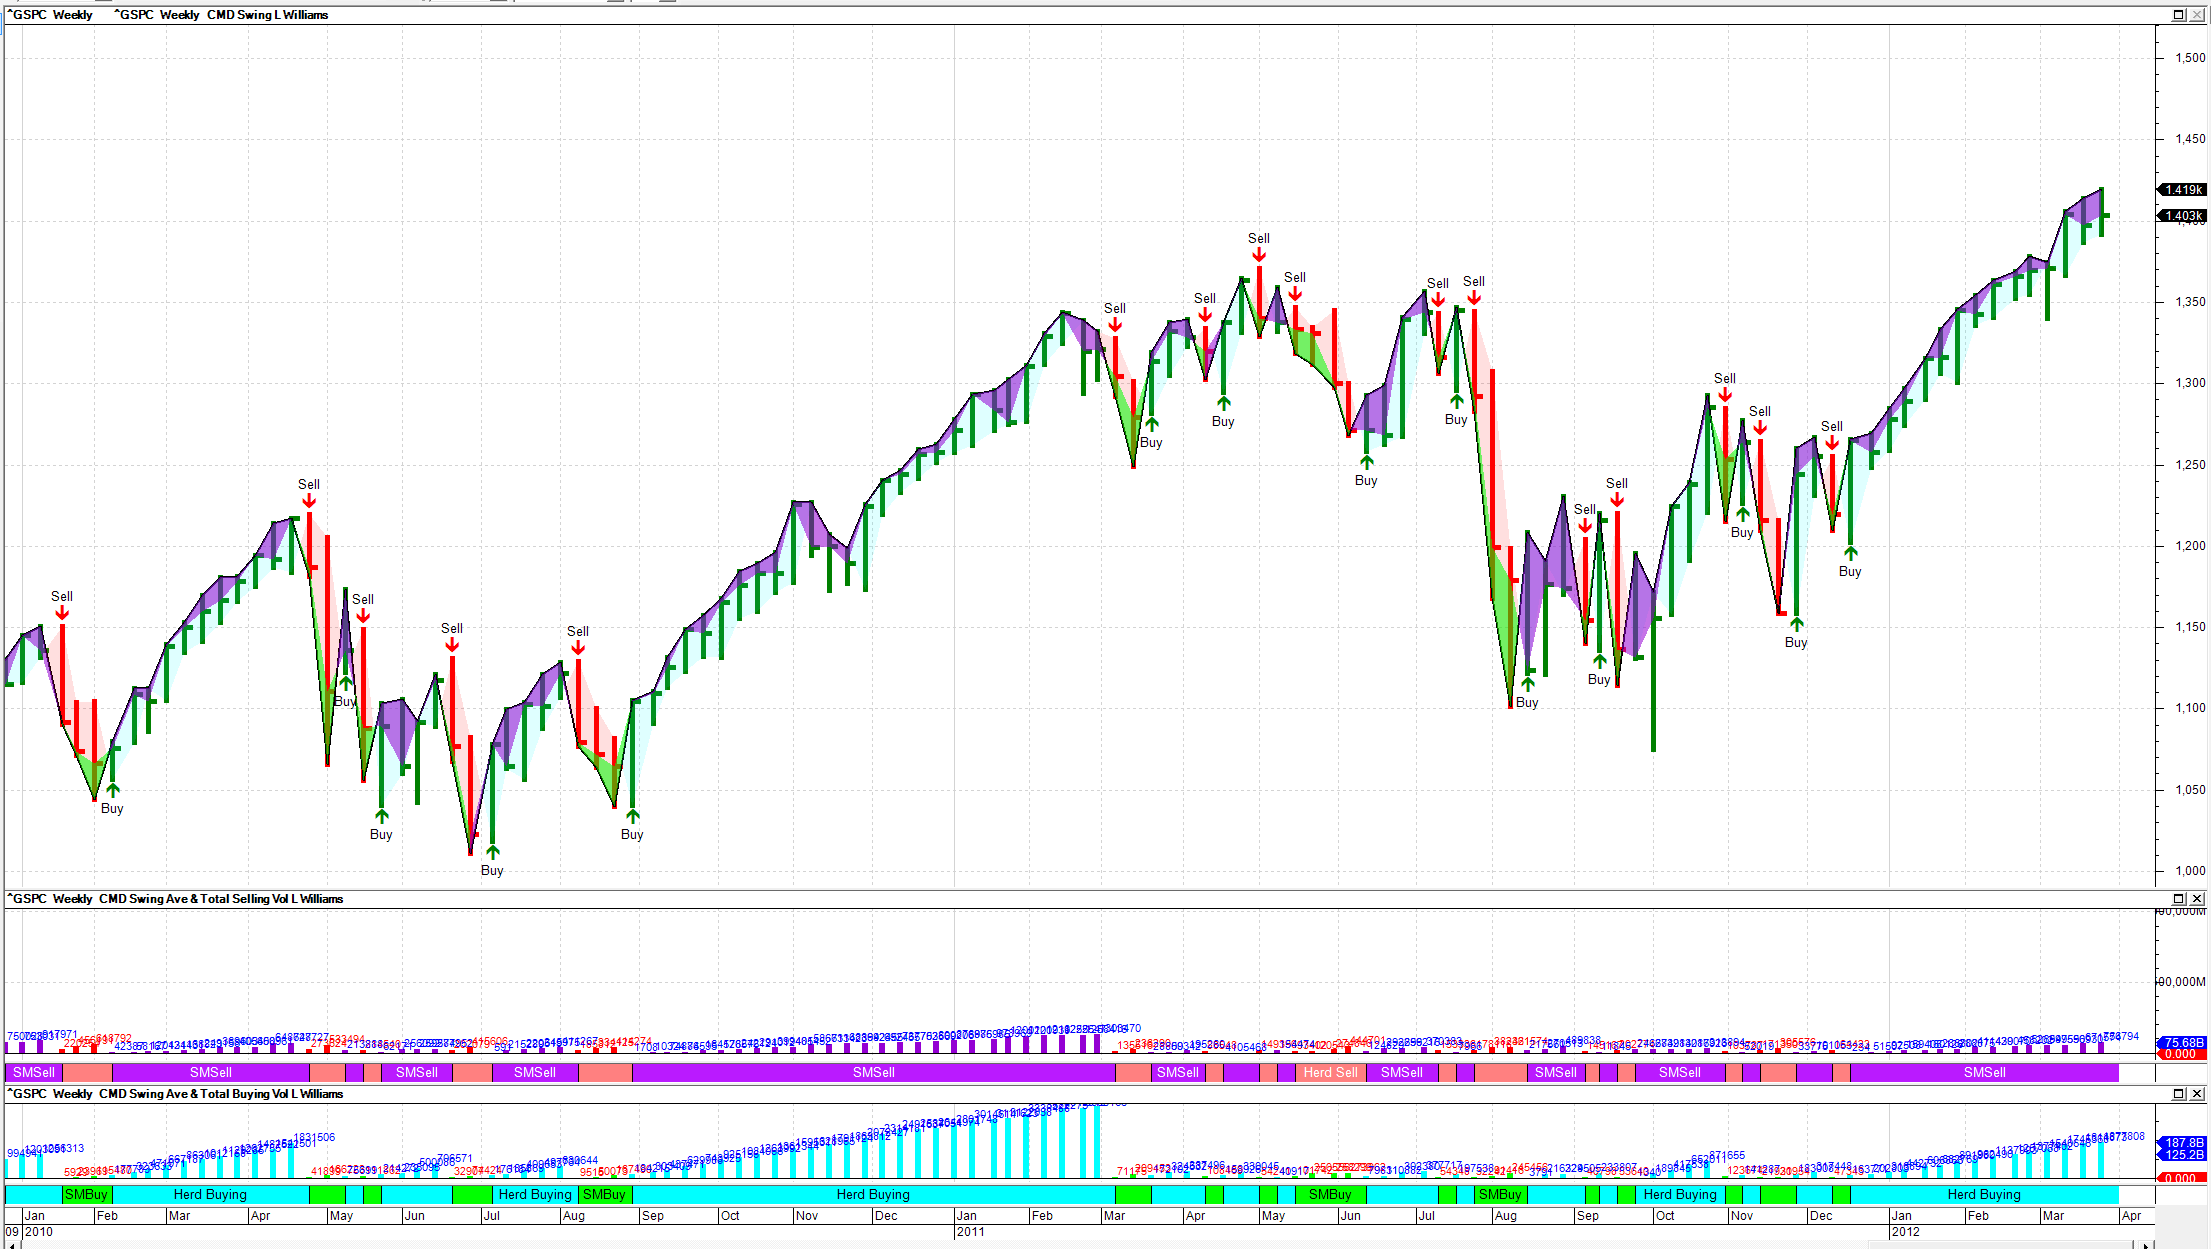
conceptual framework works reasonably well as good strong up trends tend to be
heavily coloured Cyan or Red as the Herd gathers momentum in Uptrends or panics
in down trends. When SM are heavily buying the downtrends the indicators tend
to show the down trend slowing or bottoming or when SM is heavily selling the uptrend tends to slow or stops
reasonably soon thereafter. Anyway,
something to play with. On
the Weiss Wave posts, I posted a formula for preparing a Bullcharts wave Volume
indicator. The changes needed for analysing
the wave volumes for “Smart Money” and the “Herd” is to change a few lines of
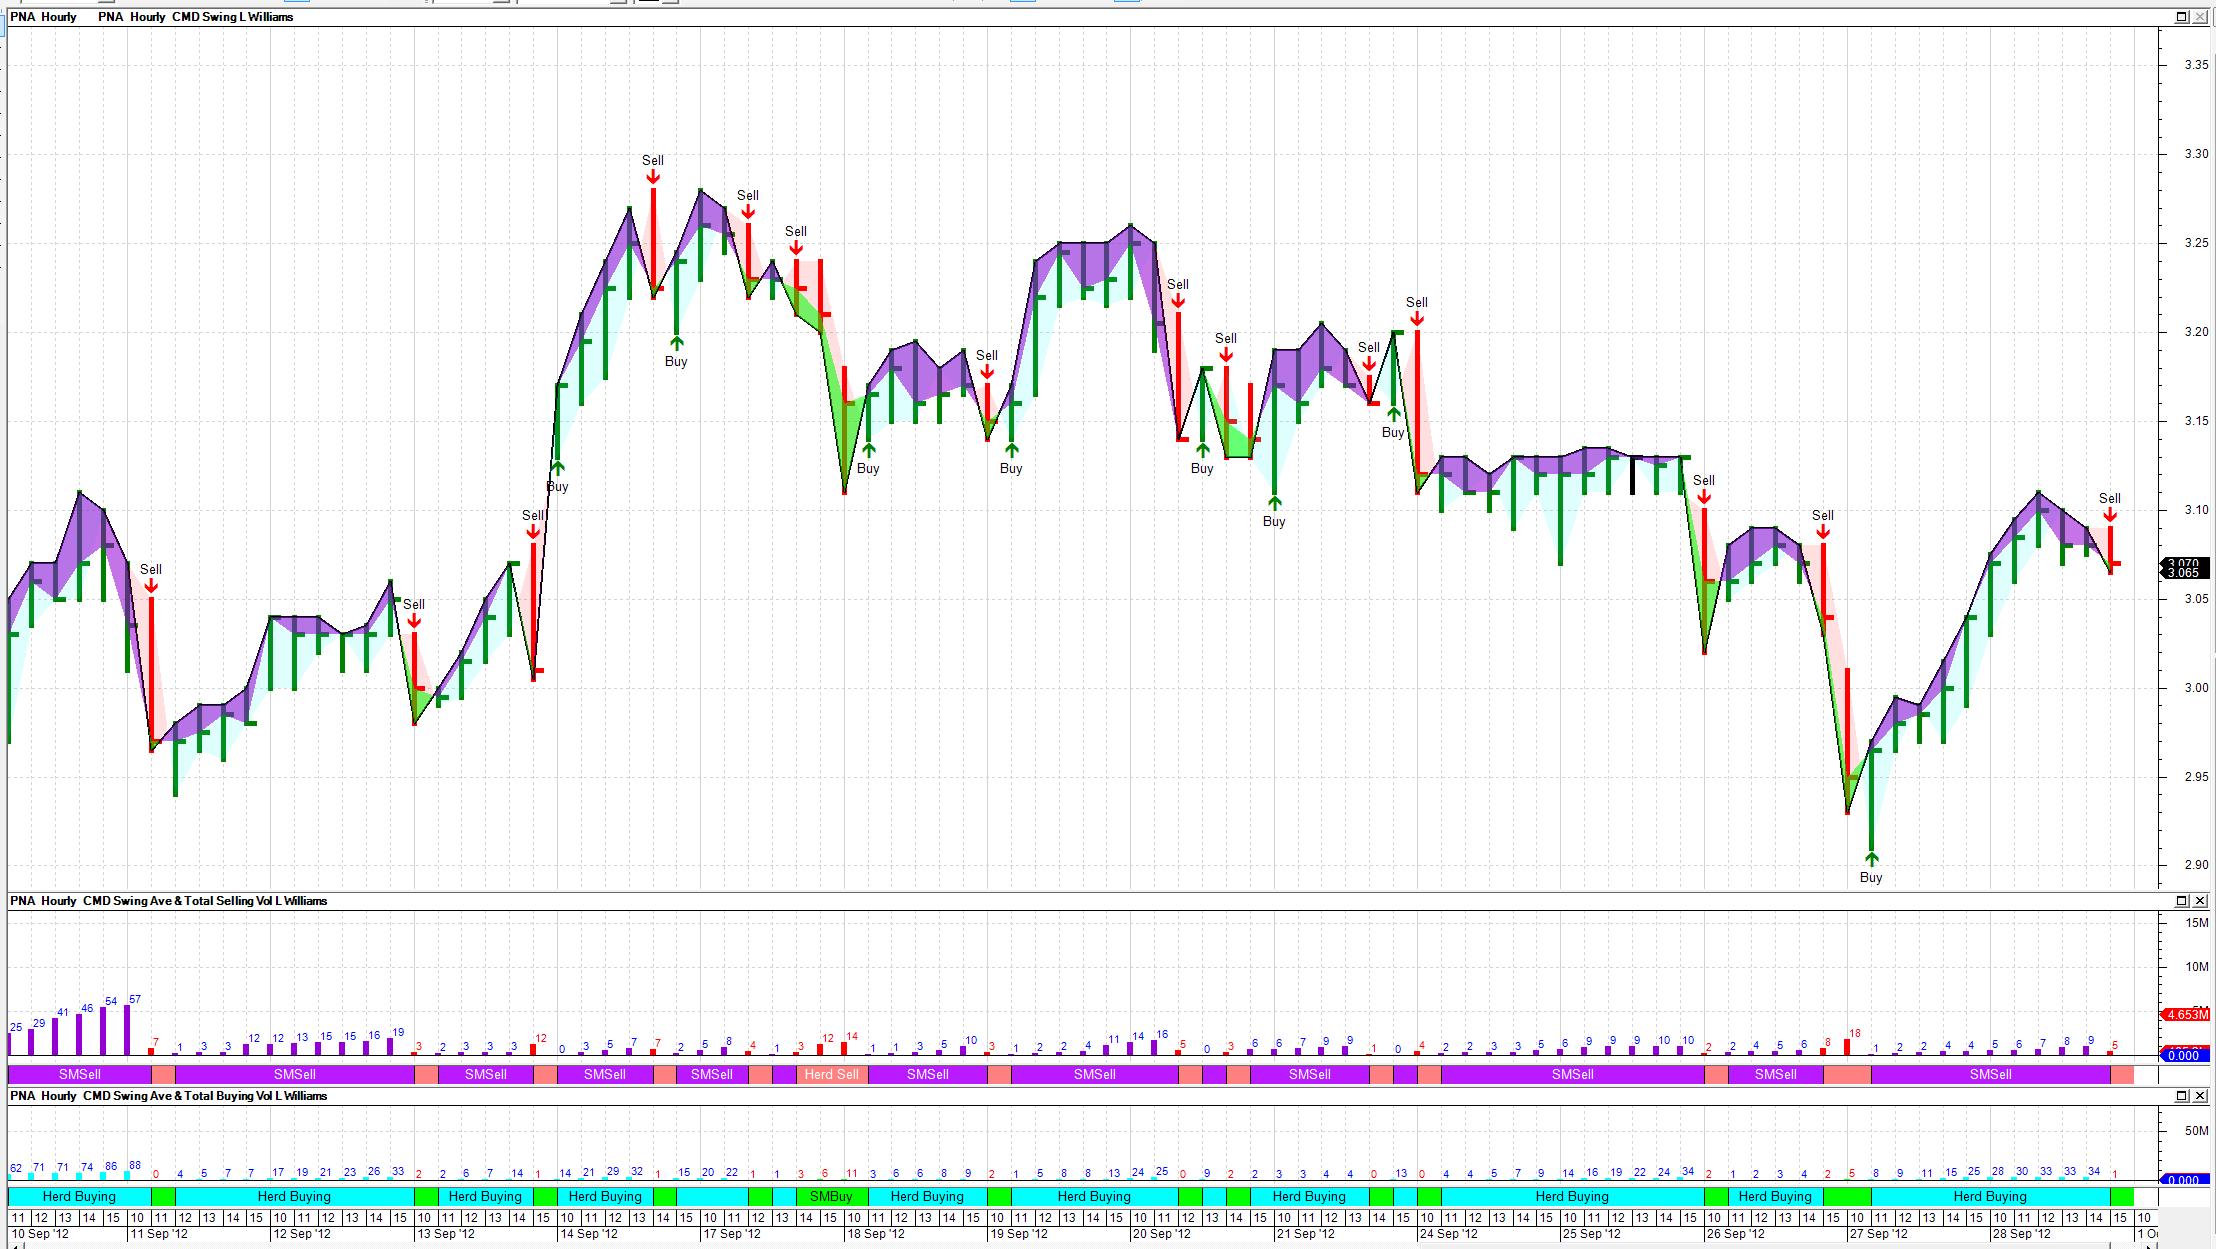
the previously advised formula as below. For
converting previous code to a SM Selling and Herd Selling average and Total Wave volume indicator. Add
Larry Willaim’s book reference above to the Citation area and add the following
new line to the code: Value1 := (((H-C)/(H-L))*Volume); {Selling Vol} And delete these two lines BuyVol2:=If(BuyVol,+1*v,0); TotalBuyVol:=If( BuyVol
,+1*v+prev(BuyVol2),0);} And replace by these two lines BuyVol2:=If(BuyVol,+1*Value1,0); TotalBuyVol:=If( BuyVol
,+1*Value1+prev(BuyVol2),0); And replace these two lines SellVol2:=If(SellVol,+1*v,0); TotalSellVol:=If( SellVol
,+1*v+prev(SellVol2),0); With these this two lines SellVol2:=If(SellVol,+1*Value1,0); TotalSellVol:=If( SellVol
,+1*Value1+prev(SellVol2),0); The above will give you the breakdown of
the selling wave Volume into a Smart Money Component and a Herd Component. For the Buying wave just copy the
amended formula, change the name to buying and Just replace the Value formula to the
formula shown below Value1 := (((C--L)/(H-L))*Volume); {Buying Vol} That’s it for the second Wave histogram. To check if you have done this correctly
the average on both these amended formulae will reconcile to the previous Wave
Volume formula. The ribbons shown on the charts are just subsets of the above amended indicators with Linestyle =Ribbon. Text for the amount of volume can be added if you want to show in text, as well as bars. |
|
|
BC User since June 2007
|
|
 |
|
|
cmacdon
BullCharts Guru
Joined: 09 Sep 2012 Location: Brisbane Posts: 236 |
Post Options
Quote Reply
Posted: 29 Sep 2012 at 6:38pm |

|
|
|
BC User since June 2007
|
|
|
|
|
cmacdon
BullCharts Guru
Joined: 09 Sep 2012 Location: Brisbane Posts: 236 |
Post Options
Quote Reply
Posted: 29 Sep 2012 at 6:39pm |
|
|
|
BC User since June 2007
|
|
|
|
|
cmacdon
BullCharts Guru
Joined: 09 Sep 2012 Location: Brisbane Posts: 236 |
Post Options
Quote Reply
Posted: 29 Sep 2012 at 6:40pm |
|
|
|
BC User since June 2007
|
|
|
|
|
joea
Newbie 
Joined: 15 Nov 2011 Location: Miallo Posts: 19 |
Post Options
Quote Reply
Posted: 29 Sep 2012 at 9:02pm |
|
cmacdon
I do not know if you are aware of the book, "Master the Markets". It can be down loaded free. Then there is Section 2 ... Trends and Volume Spread Analysis. Then there is the Trade Set up sequences. i.e. that is the complete list of SOW and SOS. This info came from Tradeguider. i.e. Short Trade Set Up. Sequence 1 SOW1 The buying climax(start of distribution) SOW104 Supply coming in(also has the appearance of an upthrust) SOW199 No demand(No demand at market top). Sequence 2 etc. joea |
|
|
|
|
joea
Newbie
Joined: 15 Nov 2011 Location: Miallo Posts: 19 |
Post Options
Quote Reply
Posted: 29 Sep 2012 at 9:15pm |
|
cmacdon
I may interpret things a little different to you. But basically my understanding is as follows. If you are a bullish trader there are 5 main signs. 1 The buying climax. 2 A failed test(a test that is not accompanied by low volume) 3 Narrow spread accompanied by high volume, on an up day, into new high ground. 4 The up thrust. 5 Sudden high volume on an up day(bar), with the next day (bar) down, on a wide spread, closing below the low of the previous bar. The herd actually buys from the smart money near the end of the rally. That is why it is called "smart money", because there would be no gain without buyers(the herd). joea. Edited by joea - 29 Sep 2012 at 9:16pm |
|
|
|
|
joea
Newbie
Joined: 15 Nov 2011 Location: Miallo Posts: 19 |
Post Options
Quote Reply
Posted: 30 Sep 2012 at 7:06am |
|
cmacdon
I thought I would explain myself a little better. In VSA software such as Tradeguider they are many SOW's and SOS's. However there are a small number of sequences for entry to long and short set-ups. Short set ups are as such. 1 SOW1 SOW104 SOW 199 2 SOW26 SOW7 SOW146 3 SOW90 SOW26 SOW198 4 SOW134 SOW10 SOW134 5 SOW5 (end of rising market) SOW2 (upthrust) SOW6 (no demand) etc. so it is not the sign of strength or weakness, but the sequence of of a combination of 3 SOS or SOW's that give the signal to alert. In the paperwork I have there are 10 short and 10 long entry set ups. no doubt there maybe the same number of exits from short and long trades. The sequence is the 'guts" of VSA. You must have the accurate volume, reflecting what the spread of the price bar is telling the trader. i.e volume spread analysis!!! I hope that explains it a little better. ..or my understanding of it. joea Edited by joea - 30 Sep 2012 at 9:19am |
|
|
|
|
joea
Newbie
Joined: 15 Nov 2011 Location: Miallo Posts: 19 |
Post Options
Quote Reply
Posted: 30 Sep 2012 at 10:14am |
|
Here is a indicator that shows the trend status.
http://www.readtheticker.com/Pages/Blog1.aspx?65tf=724_rtttrendstatus-continues-to-work-well-2012-09 joea |
|
|
|
|
cmacdon
BullCharts Guru
Joined: 09 Sep 2012 Location: Brisbane Posts: 236 |
Post Options
Quote Reply
Posted: 30 Sep 2012 at 12:51pm |
|
Joea I will try to answer you posts in point form. 1 I am aware of Master the Markets. The book was provided to me when I bought
Tradeguider in 2008. I quoted the book in the Citation on the VSA template I
posted. I also trade the London market
at night using Tradeguider as Bullcharts cannot access E-signal data. 2. In a previous post I advised that VSA signals are very
judgemental, particularly if you try to write your own code after studying the
market in context. (BTW my reading of the MM book, p111 is that the 5 signs you
list you would be interested in if you were a Bullish Trader are listed in the
Book as being the main signs of weakness.
So you would be more interested in them if your were Bearish But see
point 5 below). 3. Tom Williams in his writings and also Gavin Holmes in his
videos state that VSA signals are not
buy and sell signals they are guides to help understand the context which is what I have said in my previous
posts. 4. Gavin Holmes developed the idea of VSA sequences in his
book Trading in the Shadow of the Smart Money.
I note the sequences you list in your post are from Gavins second book. Those sequences may work under certain market
conditions using the Tradeguider Software but in some contexts the sequence may
not work. 5. For instance , Gavin Holmes often points out that in down
trends discount the Signs of Strength signals and in uptrends discount Signs of
Weakness signals. Particular sequences from the books may be Ok if you are
using the Tradeguider software and their particular parameters but they are
probably irrelevant if you are writing your own code in Bullcharts, as you may
not replicate exactly the Tradeguider software, and you will want to research
and test your own sequences. 6. Which brings me to the issue I pointed out in the VSA
template post. The setting of the parameters
and in particular selecting a trending system is very important as some signals
which rely on whether the code interprets the bar as being in an uptrend or
down trend. In this regard it is of
little help to me, or even a Tradeguider user, to go to the Read the Ticker
site to see their trending system signals as neither Tradeguider or my
particular Bullcharts VSA temp[late uses the Read the Ticker trend system. (I have tested VSA on various trend
methodologies the H-iLo zig Zag used in the Wave Volume post, the Bullcharts
Trend System , Laguerre Cross overs, MA Cross overs etc). I have settled on a trending system that
gives me reasonably accurate turning points over 3 to 5 days because that suits
my style of trading. Other people may
differ and in Tradeguider you can identify many different trends by varying
their parameters as well. 7. In regard to the use of judgement , I would also refer
you to Sebastian Manby’s Advanced VSA training videos Course provided by
Tradeguider. Sebastian is a VSA expert
and was mentored by Tom Williams but he admits his interpretation of some VSA signals
differ from Tom Williams’s as he has refined his interpretation as he has
studied the market for himself, and sometimes he points out in his videos
incorrect signals shown in the
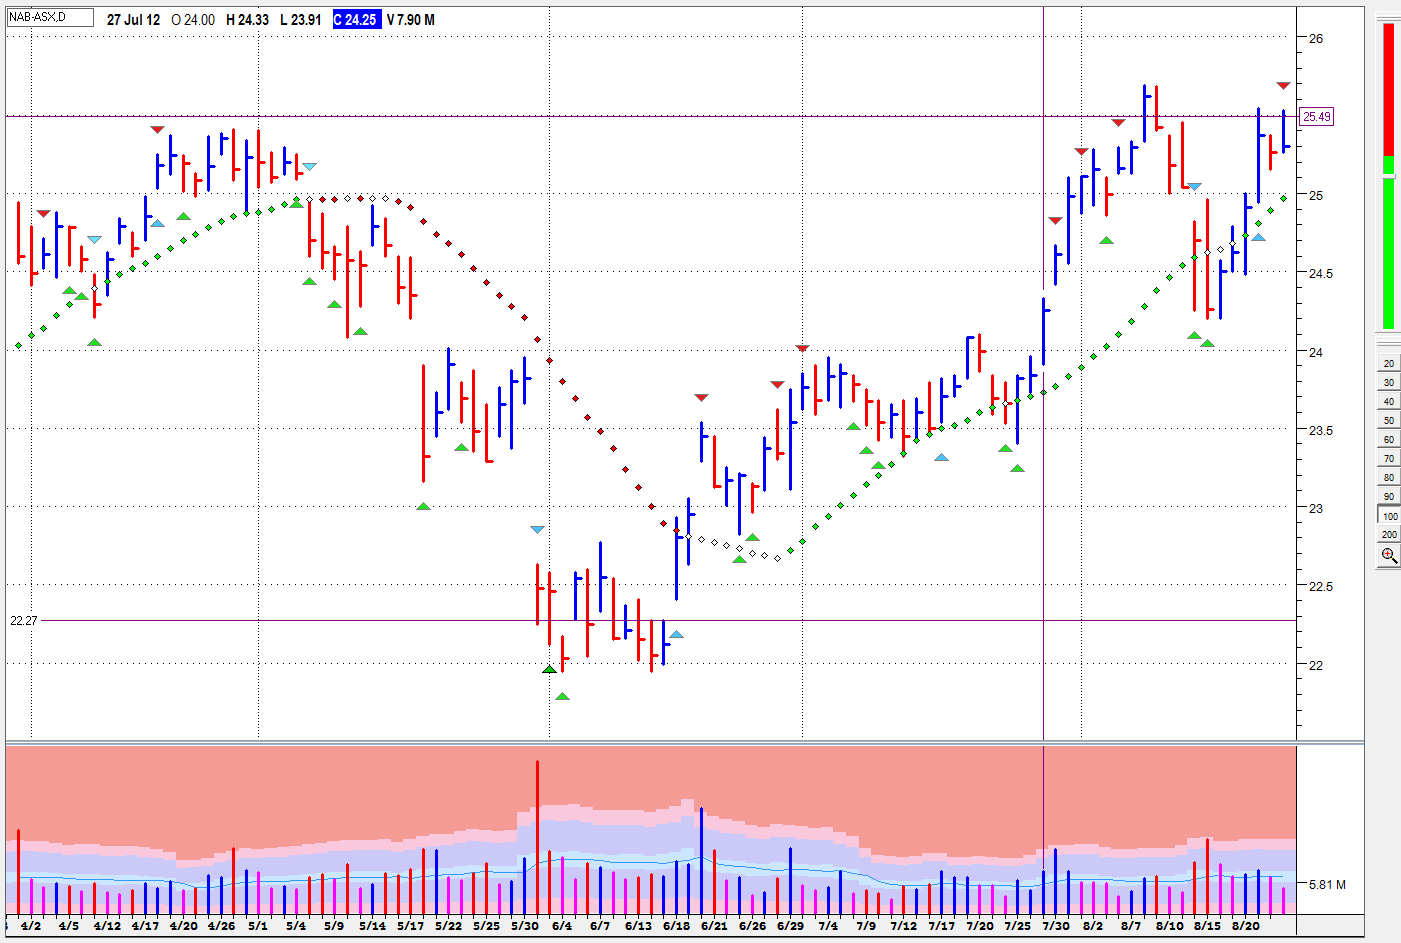
Tradeguider software. 8 In similar fashion the original Tom Williams Tradeguider
software signals and descriptions when released in the current version were
updated by Both Tom Williams and Phillip Friston another VSA expert, so they can
be updated and refined over time. 8. Getting back to identifying Smart money, here is a Tradeguider chart of NAB Bank with an uptrend and a down trend. The problem I have always had is looking at the chart how do I easily see if Smart Money is starting to get active or active. Hence my post as there is something you can do with VSA in Bullcharts that you cannot do in Tradeguider - or at least I can't.
|
|
|
BC User since June 2007
|
|
|
|
|
cmacdon
BullCharts Guru
Joined: 09 Sep 2012 Location: Brisbane Posts: 236 |
Post Options
Quote Reply
Posted: 30 Sep 2012 at 4:55pm |
|
Joea I do not know if you have look at the videos from Garry Fullet who is a Wyckoff expert (I understand he recently left LTG-Trading where he posted some great Wyckhoff trading videos and has joined a new company but as yet I have not been able to track him down in the new company) but he used to say every chart had to tell him a story. Here is my "story" for interpreting the NAB chart shown above as a Tradeguider Screen and shown below as a bullcharts screen. I can get my mind around the latter but not the former. Hope this helps you understanding of where I am coming from when you compare the two pictures. |
|
|
BC User since June 2007
|
|
|
|
|
Post Reply
|
Page 12> |
| Forum Jump | Forum Permissions You cannot post new topics in this forum You cannot reply to topics in this forum You cannot delete your posts in this forum You cannot edit your posts in this forum You cannot create polls in this forum You cannot vote in polls in this forum |


 The
indicators show the
The
indicators show the