Smart Money |
Post Reply 
|
Page <12 |
| Author |
 Printable Version Printable Version Delicious Delicious Digg Digg Facebook Facebook Furl Furl Google Boomarks Google Boomarks Google Buzz Google Buzz MySpace MySpace Newsvine Newsvine reddit reddit StumbleUpon Translate StumbleUpon Translate Twitter Twitter Windows Live Windows Live Yahoo Bookmarks Yahoo Bookmarks Topic Search Topic Search  Topic Options Topic Options
|
cmacdon 
BullCharts Guru 
Joined: 09 Sep 2012 Location: Brisbane Posts: 236 |
 Post Options Post Options
 Quote Reply Quote Reply
 Posted: 29 Sep 2012 at 6:39pm Posted: 29 Sep 2012 at 6:39pm |
|
|
|
BC User since June 2007
|
|
 |
|
|
cmacdon
BullCharts Guru
Joined: 09 Sep 2012 Location: Brisbane Posts: 236 |
Post Options
Quote Reply
Posted: 29 Sep 2012 at 6:38pm |

|
|
|
BC User since June 2007
|
|
|
|
|
cmacdon
BullCharts Guru
Joined: 09 Sep 2012 Location: Brisbane Posts: 236 |
Post Options
Quote Reply
Posted: 29 Sep 2012 at 6:37pm |
|
Tom
Williams writing about Volume Spread Analysis
(VSA) groups traders into Smart Money and the Herd. He advises that Smart Money have to sell
into uptrends and buy in to down trends which is the opposite of the way
traders normally think. This contrarian
concept has puzzled me for a long time.
Re-reading Larry William’s (no relation to Tom) book Long Term
Secrets to Short Term Trading, offers a possible solution. Larry Williams states that since 1965 his
operating rule has been “sellers in any time period are represented by the
price swing from the high of the day to the close, while buying is represented
by the close minus the low”, p.36, John Wiley & Co, 1999. I think Chaikin’s Money flow uses similar
concepts. So
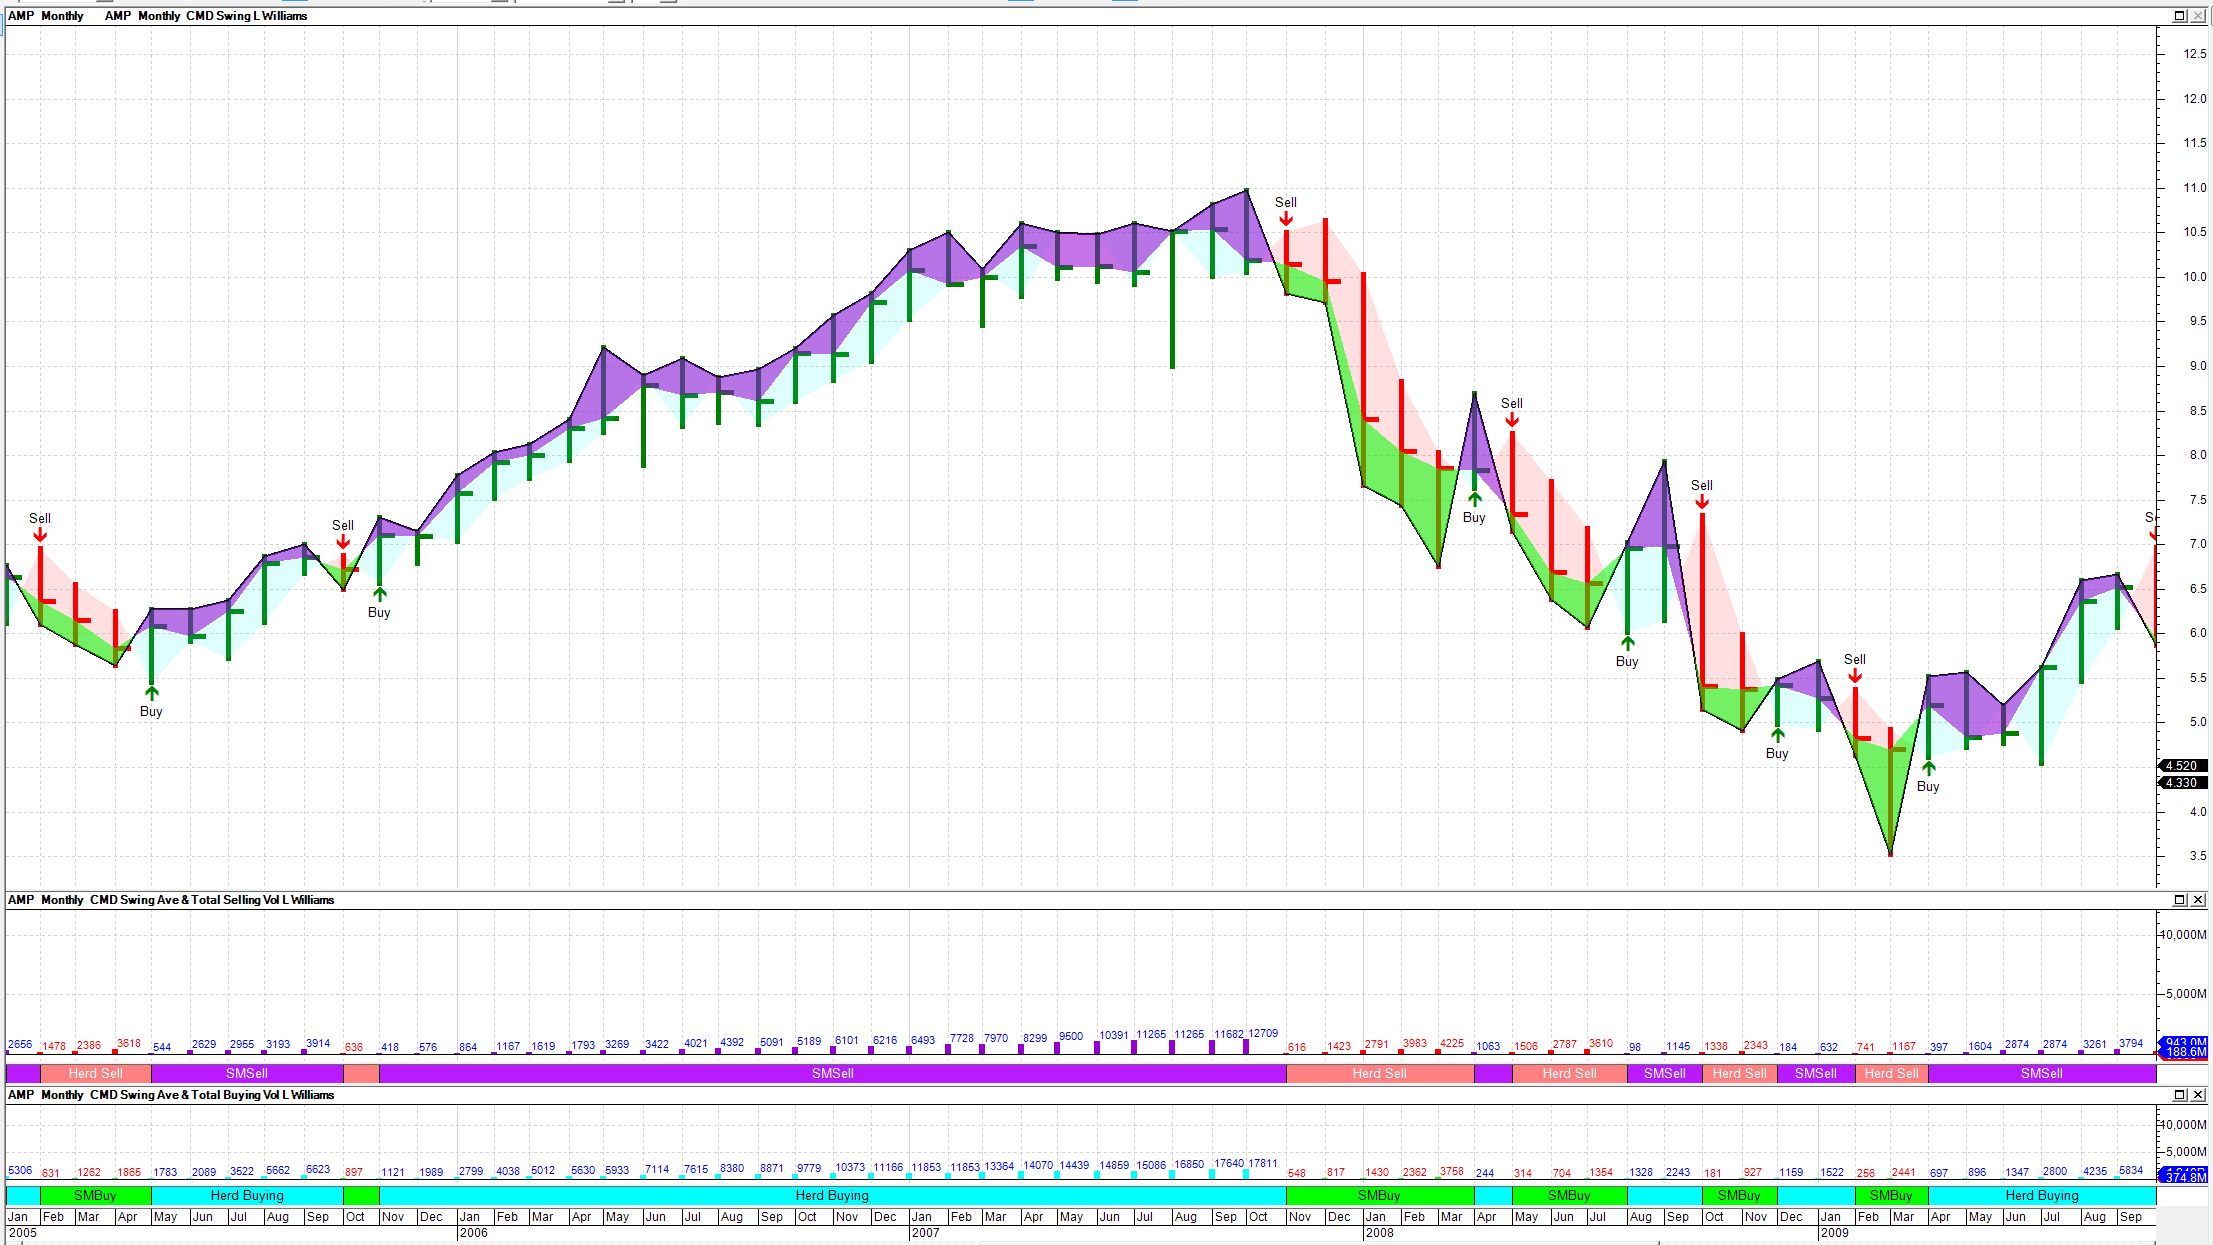
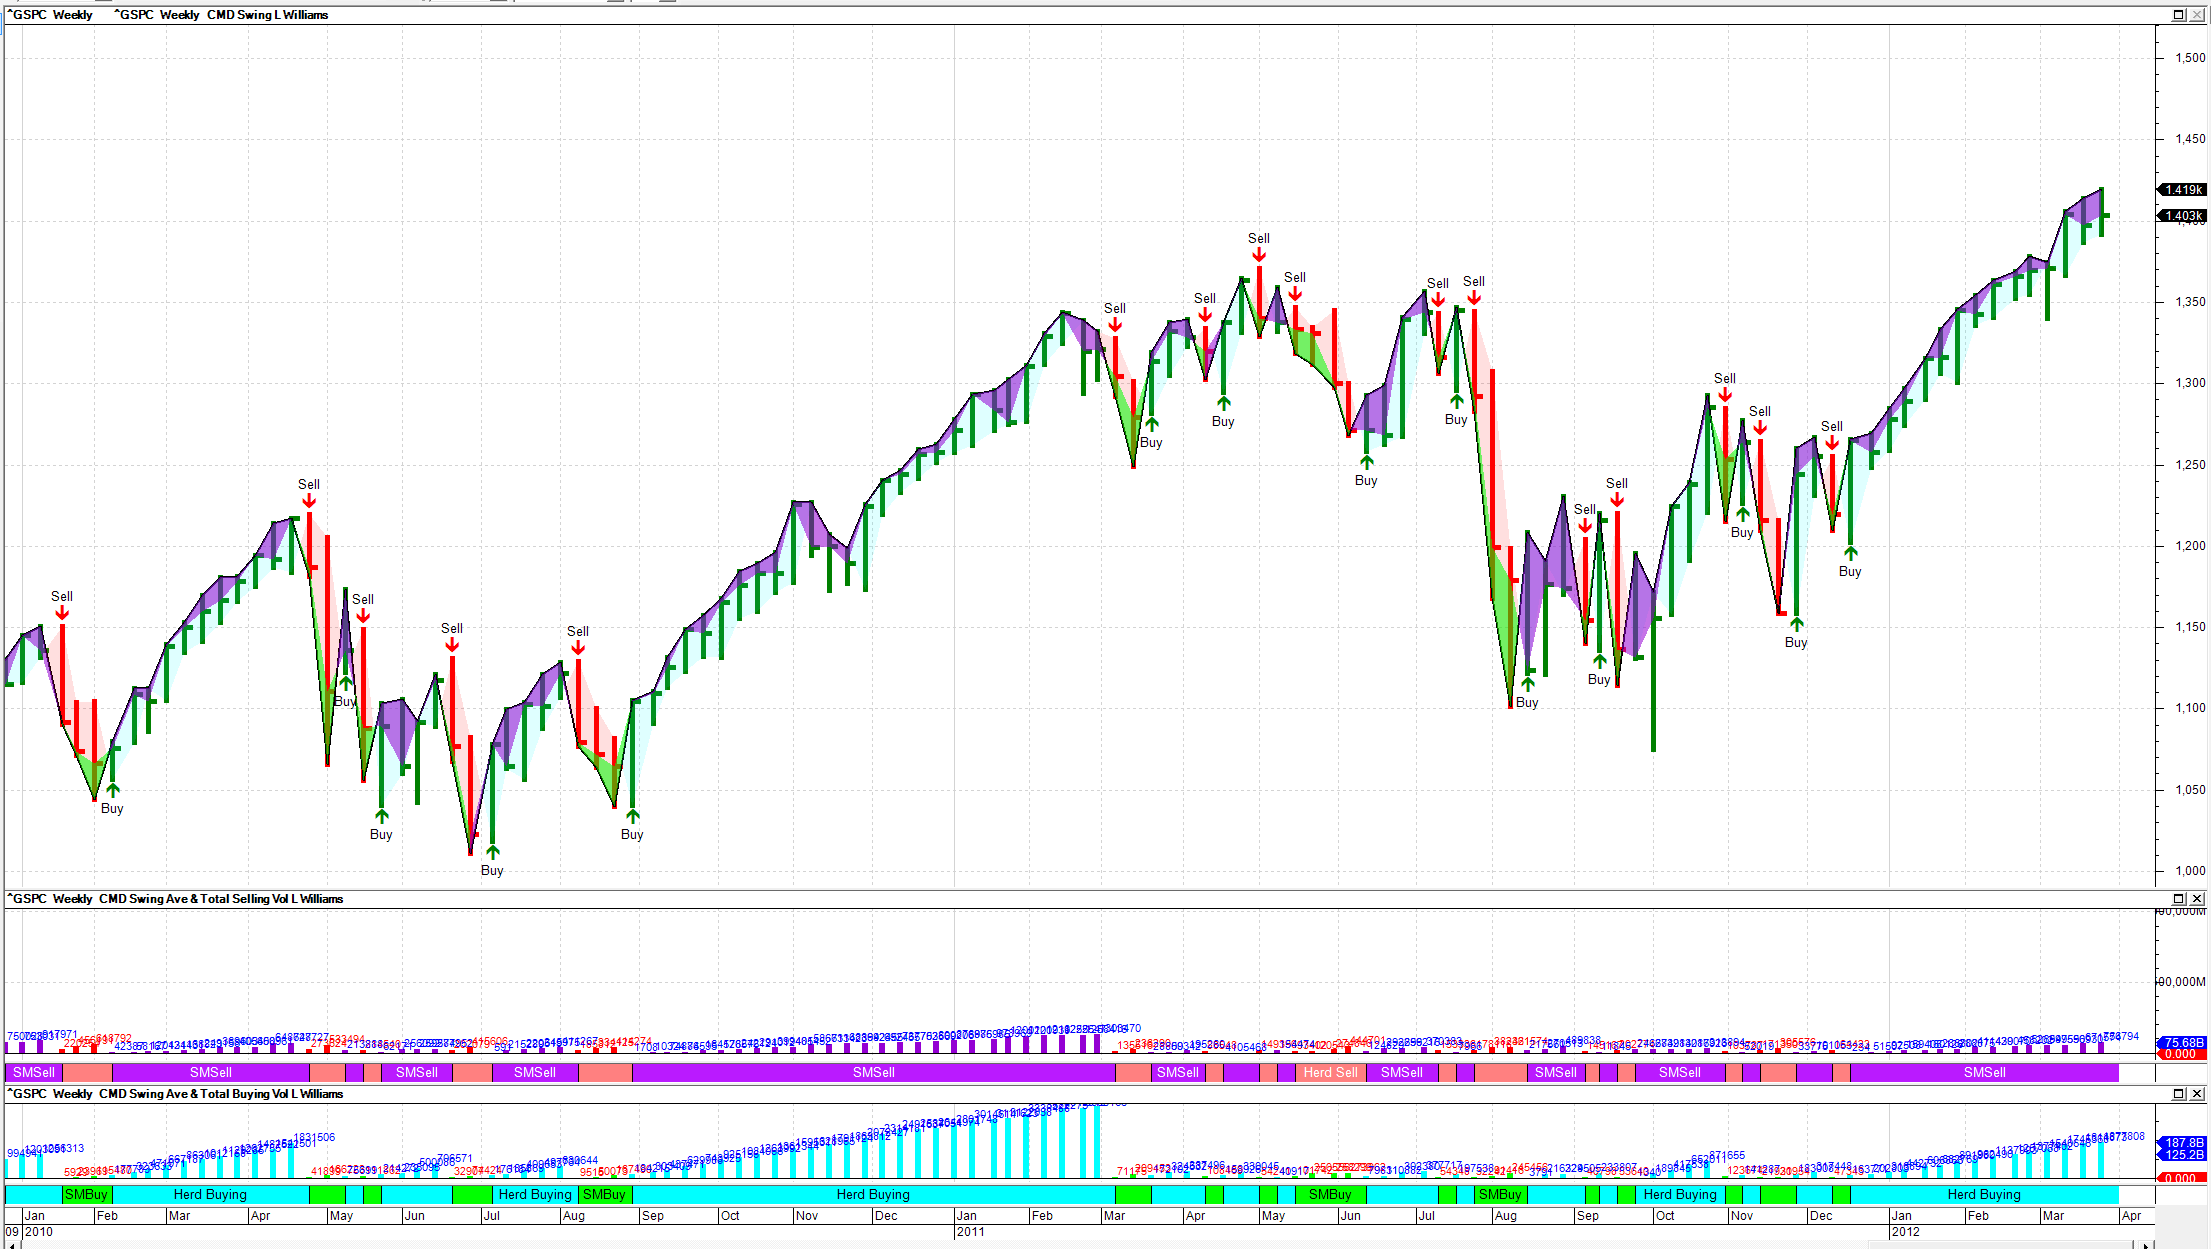
here is how my new Bull chart template looks. I adapted as discussed further
below the Wave Volume indicator provided in other post re Weiss Wave. Two indicators are required. This is not any
sort of investment advice but education on writing the indicators. The charts show Buy and Sell becasuse the markers are set up to identify start and end of trend only. The
conceptual framework works reasonably well as good strong up trends tend to be
heavily coloured Cyan or Red as the Herd gathers momentum in Uptrends or panics
in down trends. When SM are heavily buying the downtrends the indicators tend
to show the down trend slowing or bottoming or when SM is heavily selling the uptrend tends to slow or stops
reasonably soon thereafter. Anyway,
something to play with. On
the Weiss Wave posts, I posted a formula for preparing a Bullcharts wave Volume
indicator. The changes needed for analysing
the wave volumes for “Smart Money” and the “Herd” is to change a few lines of
the previously advised formula as below. For
converting previous code to a SM Selling and Herd Selling average and Total Wave volume indicator. Add
Larry Willaim’s book reference above to the Citation area and add the following
new line to the code: Value1 := (((H-C)/(H-L))*Volume); {Selling Vol} And delete these two lines BuyVol2:=If(BuyVol,+1*v,0); TotalBuyVol:=If( BuyVol
,+1*v+prev(BuyVol2),0);} And replace by these two lines BuyVol2:=If(BuyVol,+1*Value1,0); TotalBuyVol:=If( BuyVol
,+1*Value1+prev(BuyVol2),0); And replace these two lines SellVol2:=If(SellVol,+1*v,0); TotalSellVol:=If( SellVol
,+1*v+prev(SellVol2),0); With these this two lines SellVol2:=If(SellVol,+1*Value1,0); TotalSellVol:=If( SellVol
,+1*Value1+prev(SellVol2),0); The above will give you the breakdown of
the selling wave Volume into a Smart Money Component and a Herd Component. For the Buying wave just copy the
amended formula, change the name to buying and Just replace the Value formula to the
formula shown below Value1 := (((C--L)/(H-L))*Volume); {Buying Vol} That’s it for the second Wave histogram. To check if you have done this correctly
the average on both these amended formulae will reconcile to the previous Wave
Volume formula. The ribbons shown on the charts are just subsets of the above amended indicators with Linestyle =Ribbon. Text for the amount of volume can be added if you want to show in text, as well as bars. |
|
|
BC User since June 2007
|
|
|
|
|
Post Reply
|
Page <12 |
| Forum Jump | Forum Permissions You cannot post new topics in this forum You cannot reply to topics in this forum You cannot delete your posts in this forum You cannot edit your posts in this forum You cannot create polls in this forum You cannot vote in polls in this forum |


 The
indicators show the
The
indicators show the