David Weis’s Weis Wave |
Post Reply 
|
Page <12 |
| Author |
 Printable Version Printable Version Delicious Delicious Digg Digg Facebook Facebook Furl Furl Google Boomarks Google Boomarks Google Buzz Google Buzz MySpace MySpace Newsvine Newsvine reddit reddit StumbleUpon Translate StumbleUpon Translate Twitter Twitter Windows Live Windows Live Yahoo Bookmarks Yahoo Bookmarks Topic Search Topic Search  Topic Options Topic Options
|
todbull 
Newbie 

Joined: 20 Jan 2015 Location: Australia Posts: 3 |
 Post Options Post Options
 Quote Reply Quote Reply
 Posted: 31 Aug 2015 at 10:22pm Posted: 31 Aug 2015 at 10:22pm |
|
Hi cmacdon
Thanks for that programming. Been looking for something like this for ages, as it seems the true way to interpret volume and should help immensely with swing trading. I have used it and after doing some research and checking on Weis, noticed that the parameters for cumulative and average volume are reversed. ie. imo using parameter 2 for total/cumulative is the Weis way. Also Weis wave uses the cumulative volume number shown on the price chart at each pivot point. Whereas in this it shows the price pivot. When doing more research on Weis and looking at video examples of his method, he definitely does not use volume at all. Rather uses cumulative volume for each wave and his method shows this number on each pivot point. He shows that u cant interpret time based volume as a force for each wave and that the cumulative volume number for each of the waves, is a must for interpretation of what is next. So question is - any chance of updating this for these points? Or can u point me in a direction where I can get it done. |
|
 |
|
|
cmacdon
BullCharts Guru 
Joined: 09 Sep 2012 Location: Brisbane Posts: 236 |
Post Options
Quote Reply
Posted: 17 Sep 2012 at 10:50am |
|
Also a good source forunderstanding is the free nightly newsletter by David Weiss on Weissonwyckoff.com where Weiss shows how he applies Wyckoff and every few days uses his Weiss Wave for another angle on the US index
|
|
|
BC User since June 2007
|
|
|
|
|
joea
Newbie
Joined: 15 Nov 2011 Location: Miallo Posts: 19 |
Post Options
Quote Reply
Posted: 13 Sep 2012 at 4:25pm |
|
For those interested in Wyckoff etc.
visit http://www.readtheticker.com/Default.aspx Go to education and Indicator Library. Click RTT VolumeWave and you will see a number of dot points explaining the wave. joea |
|
|
|
|
cmacdon
BullCharts Guru
Joined: 09 Sep 2012 Location: Brisbane Posts: 236 |
Post Options
Quote Reply
Posted: 10 Sep 2012 at 7:45pm |
|
Imbull
As the scientist say we all standing on the shoulders of the greats who went before us. I am far from any expertise in any coding but can I adapt some combination of other indicator codes if I am really interested in the particular indicator outcome for my own use. I find the easiestt sources of coding is to adapt from either Tradersonline.tk where there are some great Metastock indicator codes particulallarly by the prolific Jose Silva, and Roy Larsen that can be easily converted to Bullscript; or some of the great bullscript coding already provided on this Bullchart forum by the prolific Maximo in particular and Blackdog, My 3 posts today are purely because I was interested over recent years in VSA, Heikin Ashi and Weiss wave and decided to to put something back of the benefits I have received from these other people when a couple of posts came up recently.
|
|
|
BC User since June 2007
|
|
|
|
|
lmbull
Newbie
Joined: 08 Dec 2006 Posts: 11 |
Post Options
Quote Reply
Posted: 10 Sep 2012 at 3:58pm |
|
Fantastic work
This one was definatly beyond my programing. I will have to get the book when it come out to break it all down. Once again thank you for your efforts.  |
|
|
|
|
cmacdon
BullCharts Guru
Joined: 09 Sep 2012 Location: Brisbane Posts: 236 |
Post Options
Quote Reply
Posted: 10 Sep 2012 at 10:49am |
|
Here are two separate indicators that may help. Each indicator needs to be coordinated by using the same vibration variable . The first one is the wave with a selectable vibration variable. I find most ASX stocks vibrate well at either 3,4,5 or 7.
The second indicator shows in a separate panel the total volume on up and down waves similar to Weiss, and you can change tot he average volume per up and down wave similar to Tim Ord's work. {Wave Indicator} [citation ="
For Total volume interpretations refer David Weiss’s Weiss Wave,
WeissonWyckoff.com; for Average Volume interpretations refer Tim Ord, The
Secret Science of Price and Volume, Wiley Trading 2008; For earlier Swing Volume accumulation
indicator refer to Jose Silva’s Volume
- Up/Down Swing Average indicator http://trader-online.tk/MSZ/e-!-v.html
"] [target=Price] {I have found that most ASX stocks up and down
moves “vibrate” to settings of between 3 to 5, and 7} Vib:=input("Vibration", 4, .001,
100); z:=Zig(If(Outside() AND Ref(H,-1)>Ref(H,-2),H,If(Outside() AND Ref(L,-1)<Ref(L,-2),L,If((Outside() OR Inside()) AND C>O,H,If((Outside() OR Inside()) AND O>C,L,If(H>Ref(H,-1),H,If(L<Ref(L,-1),L,If(Ref(H,-1)>Ref(H,-2),H,If(Ref(L,-1)<Ref(L,-2),L,C)))))))),Vib,%); ispeak
:= z>hist(z,1) and z>future(z,1); istrough
:= z<hist(z,1) and z<future(z,1); [linestyle=Solid; color=Red] z; [color=Green] [linestyle=Text; textalign=Above,Center; color=Red] if(isPeak, " " + z, undefined); High; [linestyle=Text; textalign=Below,Center;color=Green] if(isTrough, "" + z, undefined); Low; {This section colours up wave bars green and down
wave bars red} [target=Price; linestyle=PriceColor] Trendup:=Z>ref(z,-1); Trendown:=Z<ref(z,-1); [color=Green; name=Trendup] Trendup; [color=Red; name=TrendDown] Trendown; [color=white] {Wave Total or Average Volume Indicator. Set vibration to same as used in wave
indicator} [citation ="
For Total volume interpretations refer David Weiss’s Weiss Wave,
WeissonWyckoff.com; for Average Volume interpretations refer Tim Ord, The
Secret Science of Price and Volume, Wiley Trading 2008; For earlier Swing Volume accumulation
indicator refer to Jose Silva’s Volume
- Up/Down Swing Average indicator http://trader-online.tk/MSZ/e-!-v.html
"] Vib:=input("Vibration", 4, .001,
100); z:=Zig(If(Outside() AND Ref(H,-1)>Ref(H,-2),H,If(Outside() AND Ref(L,-1)<Ref(L,-2),L,If((Outside() OR Inside()) AND C>O,H,If((Outside() OR Inside()) AND O>C,L,If(H>Ref(H,-1),H,If(L<Ref(L,-1),L,If(Ref(H,-1)>Ref(H,-2),H,If(Ref(L,-1)<Ref(L,-2),L,C)))))))),Vib,%); ispeak
:= z>hist(z,1) and z>future(z,1); istrough
:= z<hist(z,1) and z<future(z,1); UpZig:=Z>ref(z,-1); DownZig:=Z<ref(z,-1); {The next section shows the total or average volume
for each up or down waves. (The part of
the formula can be easily adapted to most other indicators by defining the
parameters for the BuyVol and downvol from any other indicator. For instance if the indicator was a
crossover of the close the set up is BuyVol =c>Ma(c,30,s) and Down
Vol<Ma(c,30,s) or see adaption to HA Volume indicator)} v1:=input("1=Total volume on wave
or 2=Average volume on wave", 2, 1, 2); [linestyle=Bar; width=4] [name=Buy Vol; color=Green] Buyvol:=
Upzig; BuyVol2:=If(BuyVol,+1*v,0); TotalBuyVol:=If( BuyVol ,+1*v+prev(BuyVol2),0); Buybars:=barssince(Buyvol2=0); if(v1=2,TotalBuyVol,undefined); if(v1=1,TotalBuyVol/buybars,undefined); [name=Sell Vol; color=Red] Sellvol:=
Downzig; SellVol2:=If(SellVol,+1*v,0); TotalSellVol:=If( SellVol ,+1*v+prev(SellVol2),0); Sellbars:=barssince(Sellvol2=0); if(v1=2,TotalSellVol,undefined); if(v1=1,TotalSellVol/Sellbars,undefined); {This section shows horizontal line for comparison purposes
from latest total or average volume calculation} [width=1] [name=Total Sell Vol; Linestyle=Dash; color=Black] if(v1=2,lastvalue( TotalSellVol),undefined); if(v1=1,lastvalue( TotalSellVol/Sellbars),undefined); [name=Total Buy Vol; Linestyle=Dash; color=Blue] if(v1=2,lastvalue( TotalBuyVol),undefined); if(v1=1,lastvalue(TotalBuyVol/Buybars),undefined); |
|
|
|
|
lmbull
Newbie
Joined: 08 Dec 2006 Posts: 11 |
Post Options
Quote Reply
Posted: 27 Jun 2012 at 3:55pm |
|
I was wondering if anyone has had a look at the Weis Wave.
It looks as if the volume is added to preceeding volume if the close is up. When the close changes then the volume count restarts. 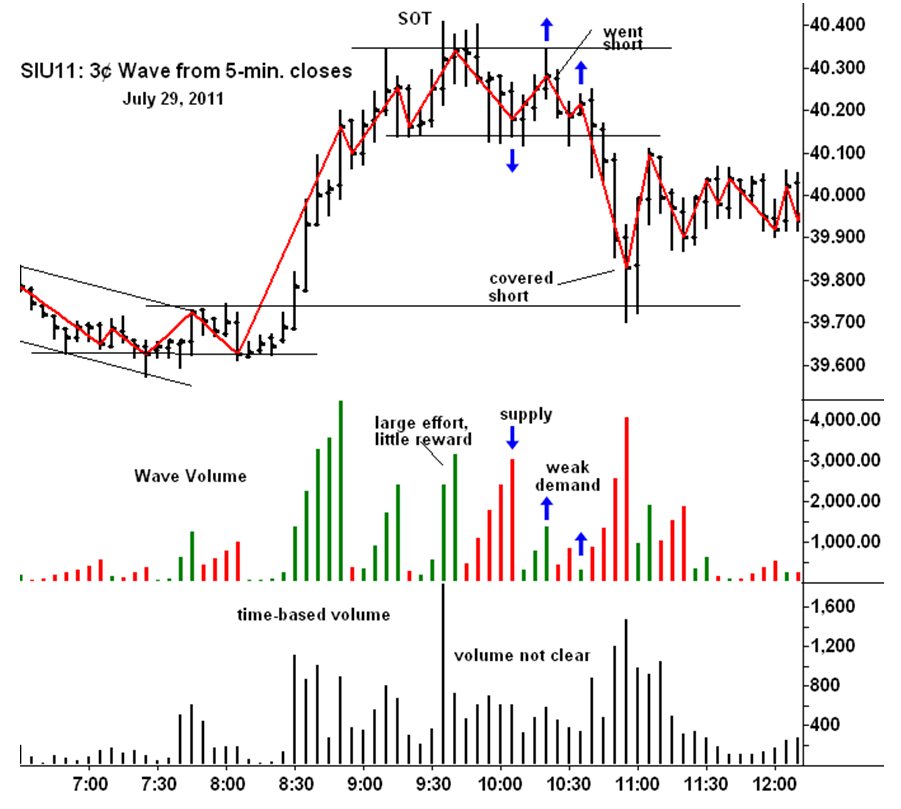 |
|
|
|
|
Post Reply
|
Page <12 |
| Forum Jump | Forum Permissions You cannot post new topics in this forum You cannot reply to topics in this forum You cannot delete your posts in this forum You cannot edit your posts in this forum You cannot create polls in this forum You cannot vote in polls in this forum |


