20% Drawdown Stop Loss |
Post Reply 
|
| Author |
 Printable Version Printable Version Delicious Delicious Digg Digg Facebook Facebook Furl Furl Google Boomarks Google Boomarks Google Buzz Google Buzz MySpace MySpace Newsvine Newsvine reddit reddit StumbleUpon Translate StumbleUpon Translate Twitter Twitter Windows Live Windows Live Yahoo Bookmarks Yahoo Bookmarks Topic Search Topic Search  Topic Options Topic Options
|
Aakash 
Newbie 
Joined: 15 Apr 2006 Location: Australia Posts: 3 |
 Post Options Post Options
 Quote Reply Quote Reply
 Topic: 20% Drawdown Stop Loss Topic: 20% Drawdown Stop LossPosted: 16 Apr 2006 at 9:06am |
|
Hi,
I am trying to construct Alan Hull's 20% Drawdown Stop Loss indicator, however have not been succesfull. I cant find the expression for the value that is a 52 week high. The logic I am trying to work on is as below -
"A Value that is a 20% drawdown from the highest closing price in the past 12 months. The 20% drawdown price level should be represented by a line on a price chart. This stop loss moves up each time the price activity makes a new high, however, that the stop loss doesn't fall when price activity retreats."
Please can someone assist me with this ?
In anticipation.
Regards,
AG
|
|
 |
|
|
Owen
Regular 
Joined: 15 Nov 2004 Posts: 97 |
Post Options
Quote Reply
Posted: 17 Apr 2006 at 6:59pm |
|
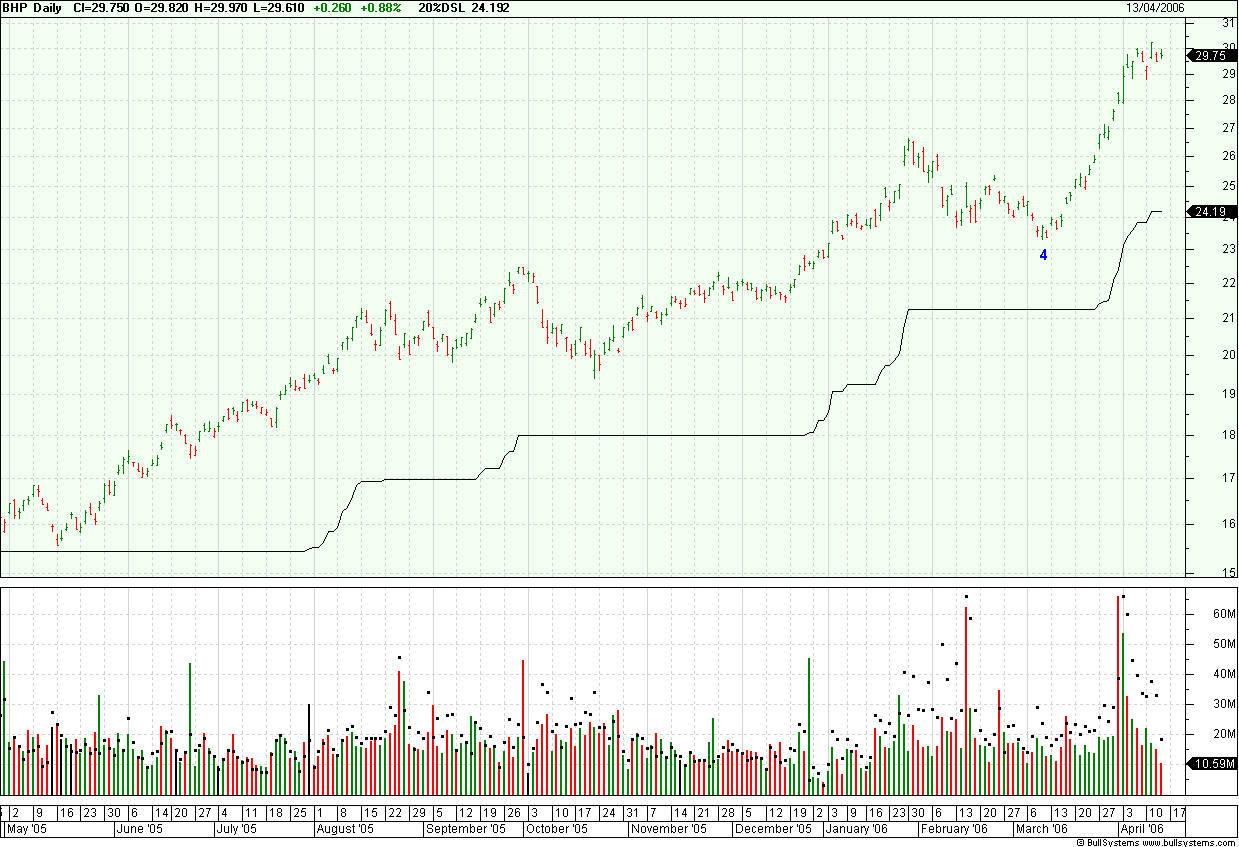
Askash, you can do it by modifying Bullcharts' built-in Wilson Trailing Stop. e.g.
[Color=Green; Target=Price] TDate:=InputDate("Date of trend", date(2004,6,25)); HoldingDays:=BarsSince(OnOrSkipped(TDate)); Stop:=HHV(c, 250)*0.8; ValueB:= If(Stop>PREV(undefined),Stop,If(Stop<=PREV(undefined), PREV(undefined),Stop*Holdingdays)); ValueB The main modification is the definition of stop. Here I use HHV(c, 250)*0.8, to get a line that is 80% of the highest close in the last 250 trading days. The other parts of the formula are used to make the line go up, starting from your trading date. I don't actually understand how they work though. I think it uses something that is not explained by Bullscript's manual. If Peter is still around perhaps he would care to explain. |
|
|
|
|
Aakash
Newbie
Joined: 15 Apr 2006 Location: Australia Posts: 3 |
Post Options
Quote Reply
Posted: 17 Apr 2006 at 9:02pm |
|
Hi Owen, Thanks very much for your response, however, it still seems to run into problems ... I tried that , say for BHP, whose 52 week high is 30.24 and with that the 20% drop would be 24.20. When this formula is applied the value comes to be 32.42 ... The closest I got constructing the 20%drawdown was modifying the Simple - Stop Loss ... but it is not scaling ... :( Wish we could debug the script to see the values it obtains as it progresses through the function .... Thanks anyways ... Cheers, Aakash
|
|
|
|
|
Owen
Regular
Joined: 15 Nov 2004 Posts: 97 |
Post Options
Quote Reply
Posted: 18 Apr 2006 at 12:32am |
|
Aakash, I use the exact same formula and it seems to work OK.
 |
|
|
|
|
Aakash
Newbie
Joined: 15 Apr 2006 Location: Australia Posts: 3 |
Post Options
Quote Reply
Posted: 18 Apr 2006 at 4:40pm |
|
Hi Owen, Thanks, I will try it again. Are you changing anything in the formula ? e.g. Thanks for all your assistance. Regards. Aakash
|
|
|
|
|
Owen
Regular
Joined: 15 Nov 2004 Posts: 97 |
Post Options
Quote Reply
Posted: 18 Apr 2006 at 6:32pm |
|
Aakash, I simply copied and pasted the formula that I posted. Absolutely nothing was changed.
I use 250 because there are 250-260 trading days in a year. The input date is supposed to be date you entered your trade, so you can change it to suit your trades. If the date is recent then the stop line will be the same. |
|
|
|
|
Post Reply
|
| Forum Jump | Forum Permissions You cannot post new topics in this forum You cannot reply to topics in this forum You cannot delete your posts in this forum You cannot edit your posts in this forum You cannot create polls in this forum You cannot vote in polls in this forum |


